The 1-minute Forex scalping strategy for the EUR/AUD currency pair combines a simple moving average and two modified RSI type indicators to identify likely overbought/oversold price levels of the market.
The scalping strategy adopts a crossover mechanism that signals for possible fast trend changes in the market.
Overall, we have demonstrated this strategy in a simplistic manner, making it easier to grasp and implement for trading.
Both scalpers and intraday traders can deploy this strategy on the M1, M5 and M15 trading charts with success.
Besides, this strategy can be trade on any other currency pair as well, preferable low spread pairs.
In order to better understand this trading strategy, we’ll show you a buy and sell trade example to further elucidate the supporting rules.
Chart Setup
MetaTrader 4 Indicators: Moving Average.ex4 (Parameters Modified;Period=44, Style=Magenta), rsi_ma_trade_sist_chart.ex4 (Inputs Variable Modified; FastEMA=15, SlowEMA=36, Colors Modified; #1=None, Colors Width Modified; #0=2, #4=2), RSIFilter.ex4 (Input Variable Modified; PeriodRSI=7)
Preferred Time Frame(s): 1-Minute, 5-Minute, 15-Minute
Recommended Trading Sessions: Any
Currency Pairs: EUR/AUD + any other pair
Download
Download the 1-Minute Forex Scalping Strategy For EUR/AUD
Buy Trade Example: EUR/AUD (EURO / Australian Dollar), M1 Chart
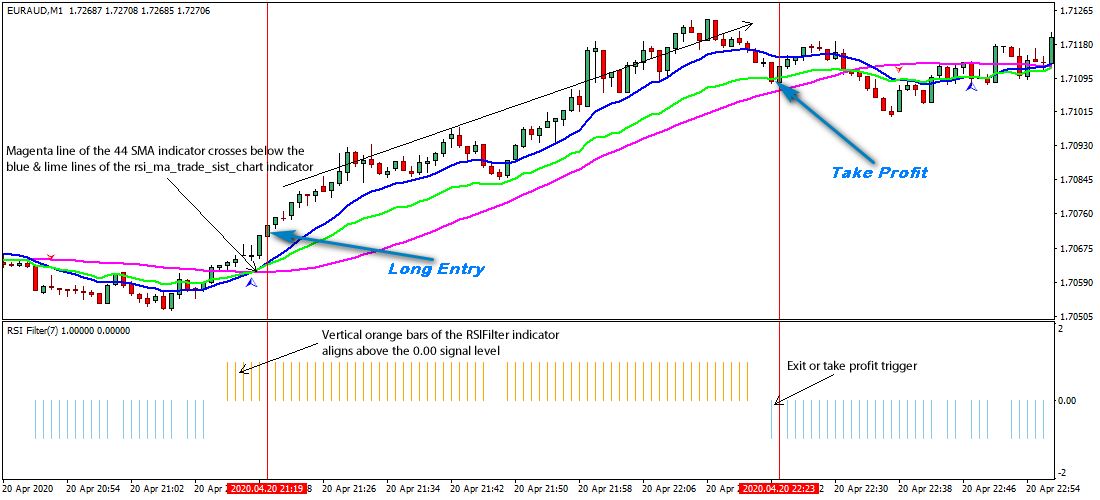
Fig. 1.0
Strategy
Long Entry Rules
Initiate a buy entry if the following indicator or chart pattern gets put on display:
- If the magenta line of the 44 SMA Metatrader 4 forex indicator crosses below the blue and lime lines of the rsi_ma_trade_sist_chart custom indicator as illustrated on Fig. 1.0, bulls are said to be driving sentiments, therefore a buy alert is duly advised.
- If the vertical orange bars of the RSIFilter indicator gets aligned somewhat above the zero horizontal level as depicted on Fig. 1.0, price is said to be driven to the upside, therefore a trigger to go long on the selected currency pair.
Stop Loss for Buy Entry: Place stop loss below short-term support.
Exit Strategy/Take Profit for Buy Entry
Exit or take profit if the following rules or conditions takes precedence:
- If while a bullish trend is ongoing, the 44 SMA indicator magenta line intersects the lime rsi_ma_trade_sist_chart indicator line as shown on Fig. 1.0, a bearish reversal is said to be imminent, hence an exit or take profit stance is recommended.
- If the RSIFilter forex indicator pops up a sky blue vertical bar below the 0.00 reference level, it is signaling a possible reversal in bullish trend, as such an exit or take profit stance will suffice.
Sell Entry Rules
Enter a sell order if the following holds true:
- If the magenta line of the 44 SMA forex indicator crosses above the blue and lime lines of the rsi_ma_trade_sist_chart custom indicator as exemplified on Fig. 1.1, the general market sentiment is said to be bearish, as such a signal to go short is apt.
- If the vertical sky blue bars of the RSIFilter indicator gets aligned fairly below the zero horizontal level as seen on Fig. 1.1, price is said to be dragged lower i.e. a trigger to go short on the currency pair of focus.
Stop Loss for Sell Entry: Place stop loss above short-term resistance.
Exit Strategy/Take Profit for Sell Entry
Exit or take profit if the following takes center stage:
- If while a bearish trend is running, the magenta line of the 44 SMA indicator intersects the lime rsi_ma_trade_sist_chart indicator line, it is pointing to a weaning bearish momentum, thus a signal to exit or take profit forthwith.
- If the RSIFilter indicator pops up an orange vertical bar above the 0.00 reference level while a bearish trend is on course (see Fig. 1.0), bears are said to be leaving the market increasingly, hence a signal to exit or take profit immediately.
Sell Trade Example: EUR/AUD (EURO / Australian Dollar), M1 Chart

Fig. 1.1
Free Download
Download the 1-Minute Forex Scalping Strategy For EUR/AUD
About The Forex Technical Indicators Used
The 44 SMA (Simple Moving Average) is a technical analysis indicator that smoothens out currency pair price data by constantly creating an updated average price over the last 44 periods.
The rsi_ma_trade_sist_chart custom indicator is comprised of the EMA and RSI indicator, thus transforming it into a very powerful trend tool.
The RSIFilter custom indicator is an oscillator that is built on the Relative Strength Index indicator, offering traders clues to overbought or oversold market conditions, along with promising trend directions.
Easy Installation
Start using this forex strategy in just 5 minutes. Click here to get started now.