The Forex Grid trading strategy allows us to place buy stop and sell stop orders in advance above and below a set price.
The strategy forms a grid of market orders at incrementally increasing and decreasing prices.
The lime horizontal line represents our open session price, while the magenta horizontal lines depicts buy stop orders placed at an incremental 10 pips.
Additionally, the blue horizontal lines are sell stop orders that are placed at a decremental 10 pips.
Having setup your trades, earning profits from both sideways and trending market becomes more feasible using this method.
Trades on this strategy are entered in a sequence of orders and watch how these trades are entered around the current price level represented in the lime horizontal line.
Chart Setup
MetaTrader 4 Indicators: DiDi_Index.ex4 (Inputs Variable Modified; MovingAvg3=28), MACD.ex4 (Default Setting)
Preferred Time Frame(s): 1-Minute, 5-Minute, 15-Minute, 30-Minute, 1-Hour, 4-Hour, 1-Day
Recommended Trading Sessions: Any
Currency Pairs: Any pair
Download
Download the 10 Pips Forex Grid Trading Strategy
Buy Trade Example: EUR/USD (EURO / US Dollar), H1 Chart
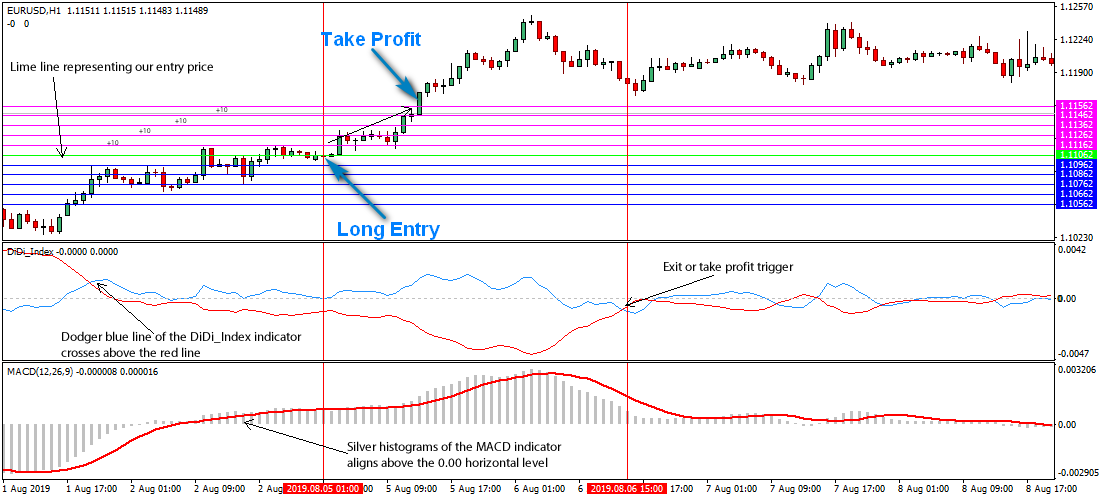
Fig. 1.0
Strategy
Long Entry Rules
Initiate a buy entry if the following indicator or chart pattern gets put on display:
- If the dodger blue line of the DiDi_Index custom indicator crosses above the red line as shown on Fig. 1.0, price is said to be driven higher, thus a trigger to go long on the designated currency pair.
- If the silver MACD histograms aligns above the 0.00 horizontal level as seen on Fig. 1.0, the overall market sentiment is said to be bullish i.e. a trigger to go long on the selected currency pair.
- If both conditions above are present, we then setup a 10 pips grid (with buy stop and sell stop orders above and below the entry price). Sentiments are more likely to be in favor of bulls (considering the trade conditions present above).
Stop Loss for Buy Entry: Place stop loss below medium-term support.
Exit Strategy/Take Profit for Buy Entry
Exit or take profit if the following rules or conditions takes precedence:
- If price picks up the result of preset parameters on its way up, it therefore means that the trades could be automatically exited on the expiration of the last grid else;
- If the dodger blue line of DiDi_Index custom indicator intersects its red line (see Fig. 1.0), bulls power is said to be weaning, therefore an exit or take profit stance is recommended.
- If the MACD Metatrader 4 indicator pops up a silver histogram below the 0.00 reference level during a bullish trend, it is signaling a likely bearish reversal, hence an exit or take profit stance will do.
Sell Entry Rules
Enter a sell order if the following holds true:
- If the red line of the DiDi_Index forex indicator crosses above the dodger blue line as illustrated on Fig. 1.1, price is said to be dragged lower, as such a trigger to go short on the stipulated currency pair.
- If the silver MACD histograms runs below the 0.00 horizontal level as exemplified on Fig. 1.1, the general market sentiment is said to be bearish, as such a sell alert is duly advised.
- If both conditions above are present, we then setup a 10 pips grid (with sell stop and buy stop orders below and above the entry price). Sentiments are more likely to be in favor of bears (considering the trade conditions present above).
Stop Loss for Sell Entry: Place stop loss above medium-term resistance.
Exit Strategy/Take Profit for Sell Entry
Exit or take profit if the following takes center stage:
- If price picks up the result of preset parameters on its way down, it therefore means that the orders could be automatically exited on the expiration of the last grid else;
- If the red line of DiDi_Index custom indicator intersects its dodger blue line (refer to Fig. 1.1), bears power is said to be halting, therefore an exit or take profit is duly advised.
- If the MACD indicator pops up a silver histogram above the 0.00 reference level, it is pointing to a likely bullish reversal, hence an exit or take profit stance will suffice.
Sell Trade Example: EUR/USD (EURO / US Dollar), H1 Chart
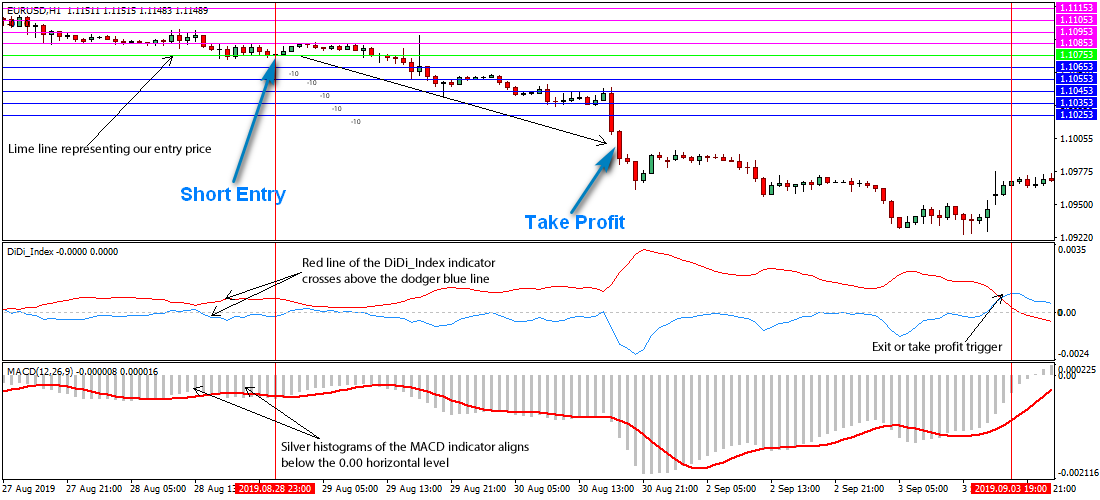
Fig. 1.1
Free Download
Download the 10 Pips Forex Grid Trading Strategy
About The Forex Technical Indicators Used
The DiDi Index custom MT4 indicator was designed by Odir Aguiar (Didi), a Brazilian analyst.
The indicator consists of a set of moving averages which enables Didi to visualize possible reversal points.
The moving average convergence divergence (MACD) is a trend-following momentum indicator that reveals the connection between two moving averages of price.
Easy Installation
Start using this forex strategy in just 5 minutes. Click here to get started now.