The 3-Bar pullback forex trading strategy is an fx trading strategy that is easy to identify by almost anyone.
It forms a series of three consecutive bearish or bullish bars for bullish and bearish pullback respectively.
The strategy is easy to adopt by newbies and advanced traders alike.
Chart Setup
MetaTrader4 Indicators: 123ForexPatterns.ex4 (default setting), RSIFilter.ex4 + RSI.ex4 (default settings)
Preferred Time Frame(s): Any
Recommended Trading Sessions: Any
Currency Pairs: Any
Download
Download the 3-Bar Pullback Forex Trading Strategy
Buy Trade Example (Click the picture for full size view)
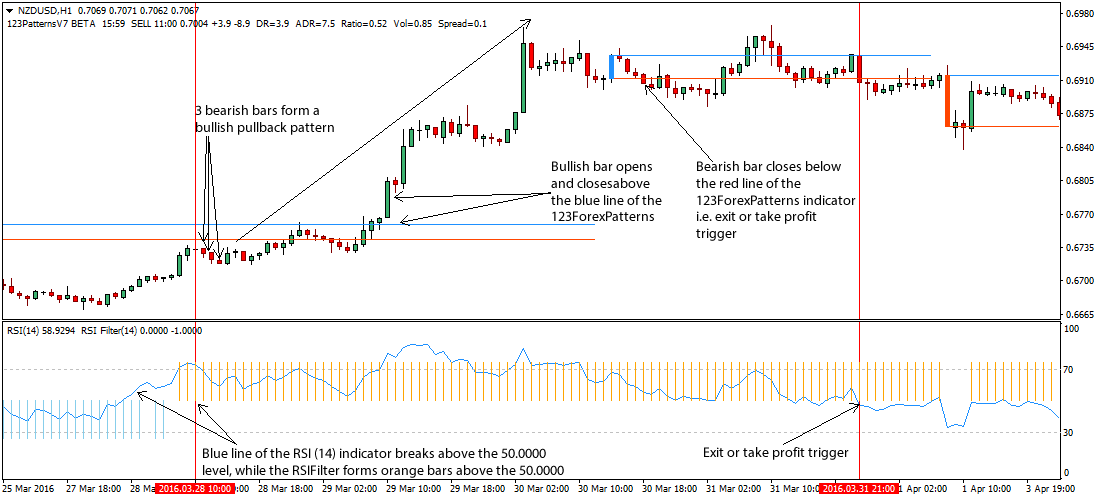
Fig. 1.0
Strategy
Long Entry Rules
Place a buy entry in the market if the following rules or conditions holds true:
- If the 3-Bar pullback patterns forms 3 consecutive bearish bars within a trending market, it implies a bullish pullback is looming i.e. a buy signal.
- If price breaks above the blue line of the 123ForexPatterns custom indicator, it is a signal to buy.
- The blue RSI (14) custom indicator line should break above the 50.0000 level (the region that holds the orange bars of the RSIFilter custom indicator), while the RSIFilter custom indicator forms orange bars above its 50.0000 level, this indicates that price is being pressured higher – an indication to go LONG.
Stop Loss for Buy Entry: Place stop loss below the most recent support level.
Exit Strategy/Take Profit for Buy Entry
Exit or take profit on position(s) if the following chart or indicator patterns holds true:
- If a bearish reversal pattern forms during the bullish trend i.e. doji or refer to other price action strategies on this section, it is therefore a trigger to exit or take profit accordingly.
- If price breaks below the red line of the 123ForexPatterns custom indicator, it is a trigger to exit or take profit.
- If the blue line of the RSI (14) MT4 indicator breaks below the 50.0000 level as shown on Fig. 1.0, or the RSIFilter MT4 indicator forms SkyBlue bars below the 50.0000, it is an indication to exit or take profit on position(s) entered.
Sell Entry Rules
Enter a sell if the following rules or conditions holds:
- If three consecutive bullish bars form a bearish pullback pattern as shown on fig. 1.1, a bears a market is in place.
- If price breaks or trades below the red line of 123ForexPatterns custom indicator, a sell signal is in place.
- If the blue line of the RSI (14) MT4 indicator breaks below the 50.0000 level, while the RSIFilter MT4 indicator also forms SkyBlue bars below the 50.0000 level as well, it is a signal to sell.
Stop Loss for Sell Entry: Place stop loss above the most recent resistance level.
Exit Strategy/Take Profit for Sell Entry
Exit or take profit on position(s) if the following chart or indicator patterns are in display:
- If a trend reversal candlestick pattern forms (refer to other price other strategies on this section), it is a trigger to exit or take profit on position(s).
- If price breaks above the blue line of the 123ForexPatterns custom indicator, an exit or take profit is appropriate.
- If the SkyBlue line of the RSI (14) MT4 indicator breaks above the 50.0000 level, while the RSIFilter custom indicator forms orange bars above the 50.0000, it is a trigger to exit or take profit.

Fig. 1.1
Free Download
Download the 3-Bar Pullback Forex Trading Strategy
About The Trading Indicators
The 3-Bar Pullback price action pattern is a series of three bullish bars (for bearish pullback pattern) or a series of three bearish bars (for bullish pullback pattern that can be pinpointed on any chart.
The 123ForexPatterns custom indicator plots support and resistance level on the activity chart via its blue and red lines respectively.
The RSI and RSIFilter custom indicator are derives for the RSI MT4 indicator and are bother plotted within the same indicator window, to offer a line signal or bar signal, usually oscillating between 0 and 100. When aligned above or below the 50.0000 mid-point level, it is said to be bullish or bearish inclined respectively.