The 5-minute Forex scalping strategy for the GBP/CAD pair is a powerful trading system that works which was primarily designed to suit scalpers.
It is able to spot short-term market trends using price filters and also by utilizing the MUV, Moving Average of Oscillator and Three Color MA indicators to confirm ensuing trend directions.
The system can be applied to diverse currency pairs within the financial markets.
Moreover, this strategy best fits the M1, M5 and M15 time frame charts that are found within the Metatrader 4 trading platform.
In a nutshell, if you’re searching for a convenient trading system that can be deployed as a scalping assistant, we recommend you giving it a try.
Chart Setup
MetaTrader 4 Indicators: MUV.ex4 (Inputs variable Modified; period=32), Three_Color_MA.ex4 (Colors Modified; #0=Blue, #1=Blue, Colors Width Modified; #0=3, #1=3, #2=3), Moving Average of Oscillator.ex4 (Inputs Variable Modified; Fast EMA=30, Slow EMA=42, MACD SMA=27, Color Modified; Style=Lime)
Preferred Time Frame(s): 1-Minute, 5-Minute, 15-Minute
Recommended Trading Sessions: London, New York, Tokyo
Currency Pairs: GBP/CAD + any other pair
Download
Download the 5-Minute Forex Scalping Strategy For GBPCAD
Buy Trade Example: GBP/CAD (Great Britain Pound / Canadian Dollar), M5 Chart

Fig. 1.0
Strategy
Long Entry Rules
Initiate a buy entry if the following indicator or chart pattern gets put on display:
- If the red line of the MUV indicator crosses below the blue line of the Three_Color_MA forex indicator in a bottom up manner as exemplified on Fig. 1.0, price is said to be driven to the upside i.e. trigger to buy the designated forex pair.
- If the lime histograms of the Moving Average of Oscillator Metatrader 4 forex indicator break and run above the zero horizontal level as depicted on Fig. 1.0, the overall market sentiment is said to be bullish, thus a trigger to go long on the desired currency pair.
Stop Loss for Buy Entry: Place stop loss below short-term support.
Exit Strategy/Take Profit for Buy Entry
Exit or take profit if the following rules or conditions takes precedence:
- If during the course of a bullish trend, the red line of the MUV indicator intersects the blue Three_Color_MA indicator line, price is said to be making a probable U-turn, therefore an exit or take profit stance is recommended.
- If the Moving Average of Oscillator indicator pops up a lime histogram below the 0.00 reference level while a bullish trend is ongoing (refer to Fig. 1.0), bulls power is said to be diminishing, hence a trigger to exit or take profit immediately.
Sell Entry Rules
Enter a sell order if the following holds true:
- If the red line of the MUV indicator crosses above the blue line of the Three_Color_MA forex indicator in a top downward fashion as seen on Fig. 1.1, price is said to be pressured lower, thus a signal to go short on the selected fx pair.
- If the lime histograms of the Moving Average of Oscillator indicator break and stack below the zero reference level as shown on Fig. 1.1, bears are said to be driving market sentiments, hence a signal to go short on the currency pair of interest.
Stop Loss for Sell Entry: Place stop loss above short-term resistance.
Exit Strategy/Take Profit for Sell Entry
Exit or take profit if the following takes center stage:
- If the red line of the MUV indicator intersects the blue Three_Color_MA indicator line while a bearish trend is running, a bullish reversal is said to be on the horizon, hence an exit or take profit stance is advised.
- If the Moving Average of Oscillator indicator pops up a lime histogram above the 0.00 horizontal level while a bearish trend is running (see Fig. 1.1), bears power is said to be halting, hence a trigger to exit or take profit at once.
Sell Trade Example: GBP/CAD (Great Britain Pound / Canadian Dollar), M5 Chart
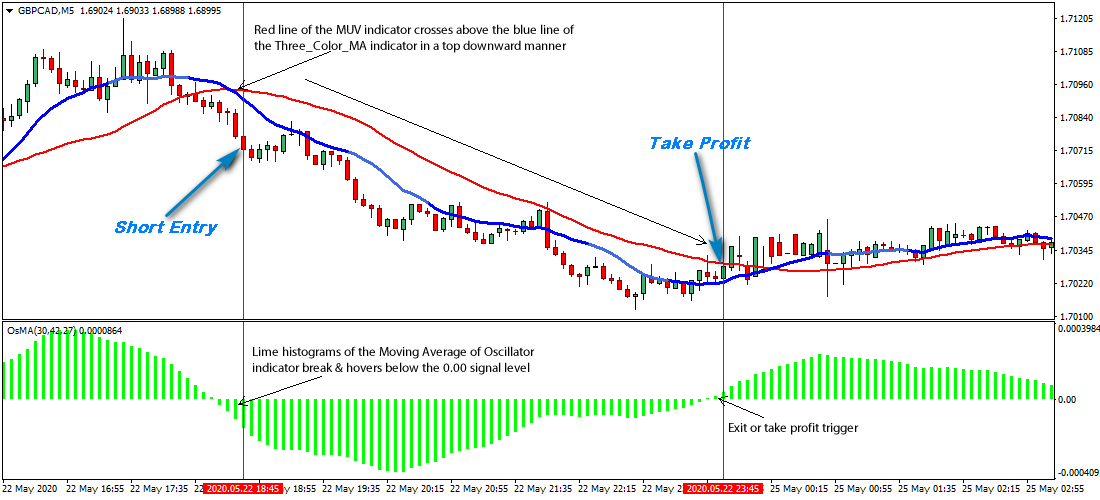
Fig. 1.1
Free Download
Download the 5-Minute Forex Scalping Strategy For GBPCAD
About The Forex Technical Indicators Used
The MUV custom indicator is a Tom Demark (TD) Moving Average indicator for MetaTrader 4 and defines the logical locations for introducing stop loss orders or closing a trade, which clearly defines how the creator Tom Demark explains the TD Moving Average indicator.
The Three_Color_MA is an alternative Moving Average that plots exponential moving average with the specific period marking diverse color movement upwards and downwards.
The Moving Average of Oscillator or OsMA is a tool that tries to spot overbought or oversold conditions by gauging how far an oscillator lies from its moving average.
Easy Installation
Start using this forex strategy in just 5 minutes. Click here to get started now.