The Alligator forex trading strategy is an easy to use system that employs the eWAVES custom indicator and the Alligator indicator.
The system does offer an effective strategy for raking in profits during noisy and less-noisy market sessions.
Chart Setup
MetaTrader4 Indicators: eWAVES.ex4 (default setting), Alligator (default setting)
Preferred Time Frame(s): 1-Minute, 5-Minutes, 15-Minutes, 30-Minutes, 1-Hour, 4-Hours, 1-Day, 1-Week, 1-Month
Recommended Trading Sessions: London & US for timeframe’s below H1, any session for timeframe’s starting from H1 and above
Currency Pairs: any
Download
Download Alligator Forex Trading Strategy
Buy Example (click the image for full size):
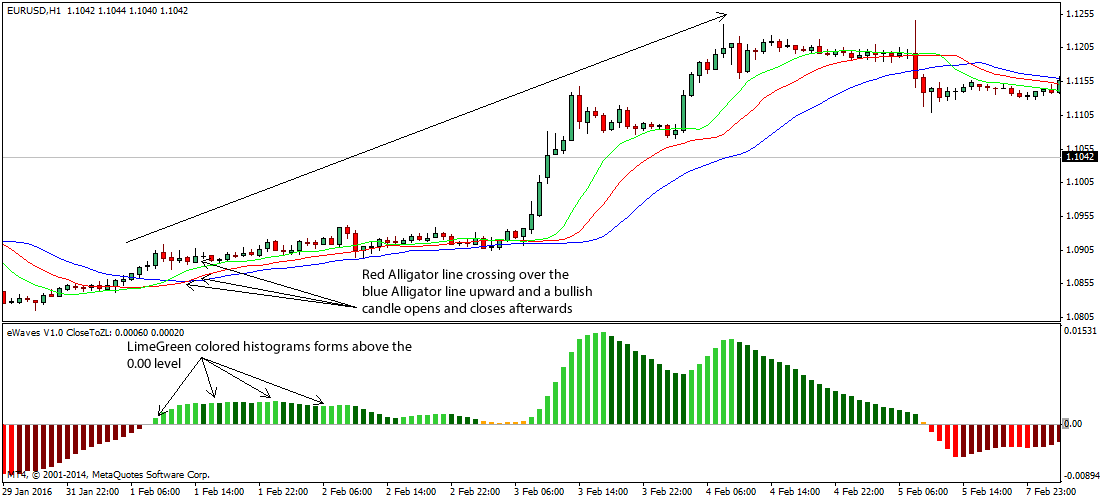
Fig. 1.0
Strategy
Long Entry Rules:
A long position is initiated when the following indicator pattern is displayed on the chart:
- When the Red Alligator line crosses over the blue Alligator line upward and a bullish candle opens and closes above the Gator lips i.e. the green Alligator line.
- Watch out for the LimeGreen colored histograms that are developing above the 0.00 level.
Stop Loss for Long Entry: ≥5-30 pips below the entry price.
Exit Strategy/Take Profit for Long Entry:
Knowing when to exit a trade is key and this can be achieved by taking note of the following indicator patterns:
- Watch out for when the red Alligator line crosses over the blue Alligator line downward.
- When a yellow histogram forms above the 0.00 following receding green histogram bars or upon having the first red histogram bar form below the 0.00 level.
Sell Entry Rules:
Take seriously the following indicator patterns and initiate short position(s) when present on chart:
- Take note of the Red Alligator line as it crosses the blue Alligator line downward and the subsequent bearish candle that opens and closes below the Gator lips i.e. the green Alligator line.
- The red colored histograms below the 0.00 level means a short position is within reach.
Stop Loss for Sell Entry: ≥5-30 pips above the entry price.
Exit Strategy/Take Profit for Sell Entry:
The exit strategy on a position(s) is triggered when the following indicator patterns are displayed on the chart:
- When the red Alligator line crosses the blue Alligator line upward, this is an indication of a looming trend reversal.
- The red colored histogram retrace and form a yellow histogram below the 0.00 mark or a green histogram above the 0.00 mark.

Fig. 1.1
Free Download
Download The Alligator Forex Trading Strategy
About The Trading Indicators
The Alligator indicator is a trend indicator that was created by Bill Williams.
Its core function is to identify trend changes by deploying the behavior of each of the three features of the indicator. The Alligator has a lot of characteristics.
One of which is, if the three lines intersect, the Alligator’s mouth is said to be asleep.
The Alligator gets famished by the minute, and wakes out of its slumber upon seeing price breakout.
The Alligator closes its mouth again when trade volume decreases or when the market is without noise.
The eWAVES indicator deploys colored histogram that are derived from Bill Williams Awesome Oscillator.
The histogram data calculates Elliot Waves 3, 4, and 5 and plots the count on the histogram window and the activity chart.