The AMA Expert forex trading strategy allows currency traders to get in and out of the market rapidly and profitably as well.
Implementing this strategy unto charts is hassle-free and works well on M1, M5 and M15 trading charts. This strategy works well for scalpers and day traders.
Chart Setup
MetaTrader4 Indicators: AMA_for_Expert2.ex4 (width modified; 2), RSItv.ex4 (default setting), RSTL.ex4 (default setting)
Preferred Time Frame(s): 1-Minute, 5-Minutes, 15-Minutes
Recommended Trading Sessions: New York Open | London Open
Currency Pairs: Low spread pairs, 4 pips maximum
Download
Download the AMA Expert Forex Scalping Trading Strategy
Buy Trade Example

Fig. 1.0
Strategy
Long Entry Rules
Initiate a long entry if the following indicator or chart pattern gets displayed:
- If the dark violet line of the RSTL custom indicator crosses the lime colored line of the AMA_for_Expert2 indicator bottom up as seen on Fig. 1.0, it is a signal to go bullish i.e. a buy entry. Usually, the dark violet line of the RSTL indicator aligns itself below the lime colored line AMA_for_Expert2 indicator, while price is seen to be trading above it.
- If the Lime colored line of the RSItv.ex4 custom indicator breaks above the 50.00 signal level, price is said to be bullish and a buy entry is most appropriate.
Stop Loss for Buy Entry: Place stop loss below short-term support.
Exit Strategy/Take Profit for Buy Entry
Exit or take profit if the following rules or conditions are in place:
- If price closes below the dark violet line of the RSTL indicator or if the lime colored line of the AMA_for_Expert2 indicator crosses the dark violet line of the RSTL indicator top downward, it is a signal to exit or take profit without delay.
- If the line of the RSItv.ex4 custom indicator breaks below the 50.00 level while its color turns red, it is a sign of weaning bullish momentum and an exit or take profit is advised.
Sell Entry Rules
Place a sell order if the following indicator or chart pattern gets displayed:
- If the dark violet line of the RSTL custom indicator crosses the lime colored line of the AMA_for_Expert2 indicator top downward as seen on Fig. 1.1, it is a trigger to go bearish i.e. a sell entry. The dark violet line of the RSTL indicator is positioned above the lime colored line AMA_for_Expert2 indicator, while price is seen to be trading below it. The wider the distance between them, the stronger the trend will be.
- If the red colored line of the RSItv.ex4 custom indicator breaks below the 50.00 signal level, price is said to be bearish i.e. a trigger to go short.
Stop Loss for Sell Entry: Place stop loss above short-term resistance.
Exit Strategy/Take Profit for Sell Entry
Exit or take profit if the following rules or conditions take precedence:
- If price closes above the dark violet line of the RSTL indicator or if the lime colored line of the AMA_for_Expert2 indicator crosses the dark violet line of the RSTL indicator bottom up, it is a signal to exit or take profit straight away.
- If the line of the RSItv.ex4 custom indicator pushes above the 50.00 signal level while its color turns lime, it is a sign of weaning bearish momentum and an exit or take profit is advised.
Sell Trade Example
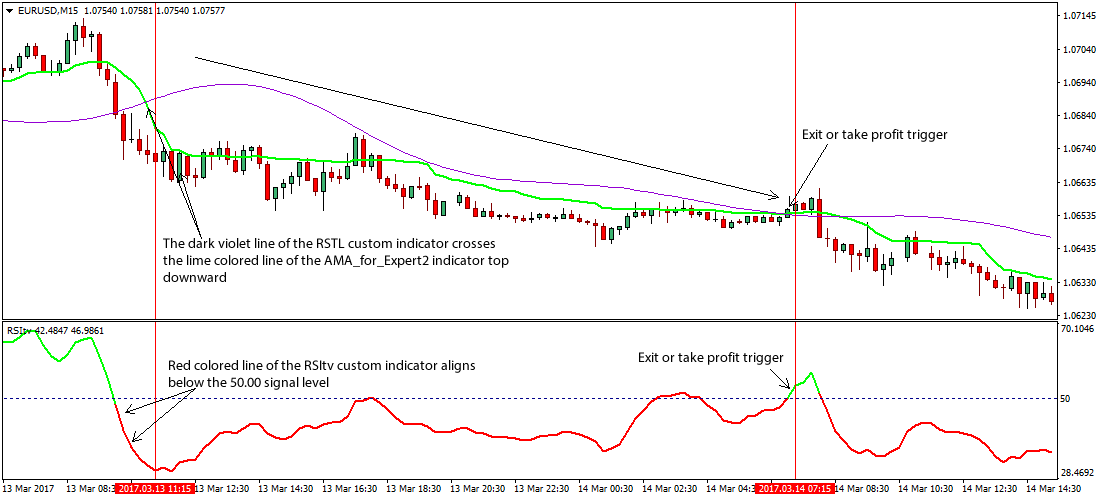
Fig. 1.1
Free Download
Download the AMA Expert Forex Scalping Trading Strategy
About The Trading Indicators
The RSItv.ex4 is an indicator deigned for the MT4 platform and is a smoothed Relative Strength Index that produces a sound alert when the 50.00 signal level is crossed (upward or downward).
The Reference Slow Trend Line (RSTL) is a response “slow” trend line. The indicator is similar to the simple moving “averages” from the standpoint of their delay in relation to the current prices.
The AMA_for_Expert2.ex4 is an optimized variant of the Adaptive Moving Average (AMA), and does take into account the volatility ratio.
The line of the indicator smoothens out greatly to yield a slower average, which invariably should produce more consistent result during price consolidation or sideways market.