The AUD/CHF 1-Hour Forex swing trading strategy works great on the H1 trading charts and above.
We’ve tested this strategy on the AUD/CHF pair successfully but it should be working fine on any other currency pair of your preference.
We have carefully designed the strategy with a blend of the enhanced Elliot Wave Oscillator and MACD indicator for spotting the best market trends on the higher time frames.
This strategy gives you the ability to capture medium-term price momentum and ride the trend.
Chart Setup
MetaTrader 4 Indicators: Holt_double_exponential_smoothing_2.2.ex4 (Inputs Variable Modified; Estimate period=28.66, Trend period=24.0), Elliot Wave Oscillator34.ex4 (Default Setting), MACD.ex4 (Parameters Modified; Fast EMA=17, Slow EMA=31, MACD SMA=14)
Preferred Time Frame(s): 1-Hour, 4-Hour, 1-Day, 1-Week, 1-Month
Recommended Trading Sessions: Any
Currency Pairs: Any pair
Download
Download the AUD/CHF 1-Hour Forex Swing Trading Strategy
Buy Trade Example: AUD/CHF (Australian Dollar / Swiss Franc), H1 Chart
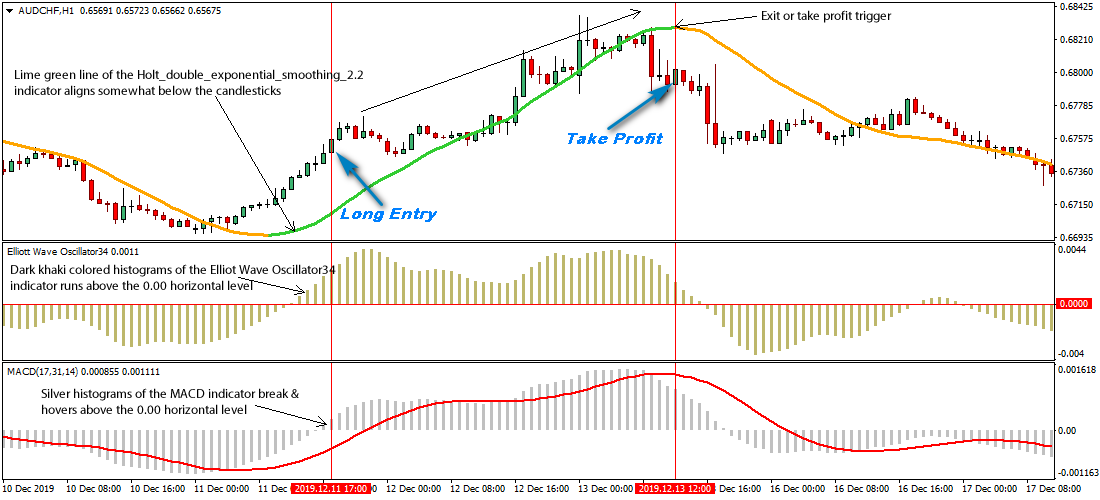
Fig. 1.0
Strategy
Long Entry Rules
Initiate a buy entry if the following indicator or chart pattern gets put on display:
- If the lime green line of the Holt_double_exponential_smoothing_2.2 custom indicator runs slightly below the price bars as shown on Fig. 1.0, the general market sentiment is said to be bullish, as such a buy alert will suffice.
- If the dark khaki colored histograms of the Elliot Wave Oscillator34 forex indicator run above the 0.00 horizontal level as seen on Fig. 1.0, price is said to be pushed higher, thus a buy alert is recommended.
- If the silver histograms of the MACD Metatrader 4 forex indicator break & hover above the zero reference level, bulls are said to be taking over the market, hence a trigger to buy the designated currency pair.
Stop Loss for Buy Entry: Place stop loss below medium-term support.
Exit Strategy/Take Profit for Buy Entry
Exit or take profit if the following rules or conditions takes precedence:
- If the lime green line of the Holt_double_exponential_smoothing_2.2 indicator reverts to orange during the course of a bullish trend (see Fig. 1.0), a bearish reversal is said to be looming, therefore an exit or take profit stance will suffice.
- If the Elliot Wave Oscillator34 custom indicator pops up a dark khaki histogram that’s aligned below the 0.00 reference level during the course of a bullish trend, bulls power is said to be weaning, hence a signal to exit or take profit forthwith.
- If the MACD indicator pops up a silver histogram below the 0.00 signal level while a bullish trend is running, it is pointing to diminishing bulls power, as such an exit or take profit stance is apt.
Sell Entry Rules
Enter a sell order if the following holds true:
- If the orange line of the Holt_double_exponential_smoothing_2.2 custom indicator hovers above the candlesticks as exemplified on Fig. 1.1, the overall market sentiment is said to be bearish, as such a sell alert will do.
- If the dark khaki colored histograms of the Elliot Wave Oscillator34 forex indicator hover below the 0.00 signal level as depicted on Fig. 1.1, bears are said to be driving price lower, thus a signal to go short on the designated forex pair.
- If the silver histograms of the MACD forex indicator dip & run below the zero horizontal level, bears are said to be the dominant market force, therefore a sell alert is duly recommended.
Stop Loss for Sell Entry: Place stop loss above medium-term resistance.
Exit Strategy/Take Profit for Sell Entry
Exit or take profit if the following takes center stage:
- If the orange line of the Holt_double_exponential_smoothing_2.2 indicator changes to lime green while a bearish trend is ongoing (refer to Fig. 1.1), a bullish reversal is said to be imminent, therefore an exit or take profit stance will do.
- If the dark khaki histogram of the Elliot Wave Oscillator34 indicator realigns to pop up above the 0.00 signal level while a bearish trend is ongoing, it is a trigger to exit or take profit straightway.
- If the MACD indicator pops up a silver histogram above the 0.00 signal level while a bearish trend is on course, it is pointing to halting bears power, as such an exit or take profit stance is duly advised.
Sell Trade Example: AUD/CHF (Australian Dollar / Swiss Franc), H1 Chart
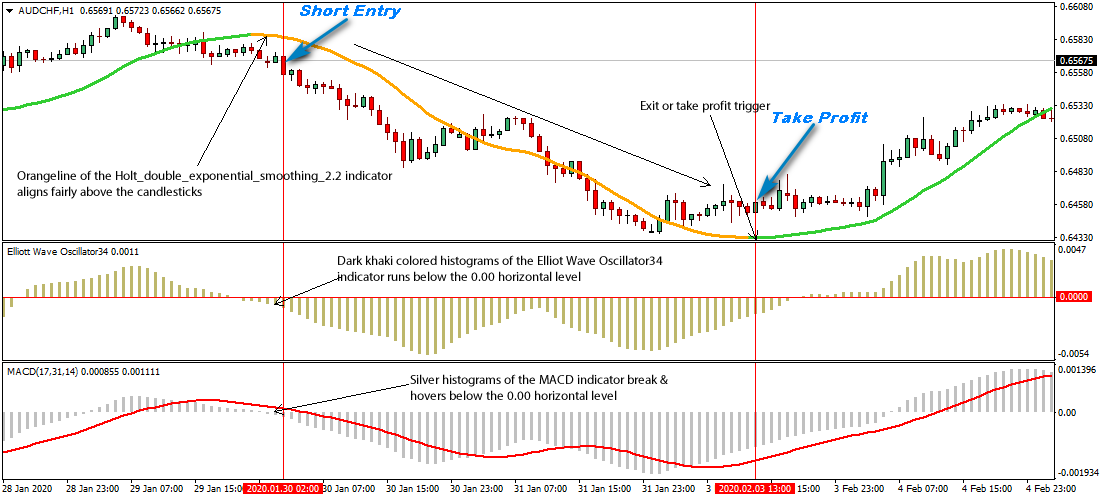
Fig. 1.1
Free Download
Download the AUD/CHF 1-Hour Forex Swing Trading Strategy
About The Forex Technical Indicators Used
The Holt_double_exponential_smoothing_2.2 is a trend following indicator that is essentially used for forecasting but not as an average.
It deploys linear forecasting when performing its forecasting method.
The Elliot Wave Oscillator34 is an oscillator that plots the difference of a 34 and a 5 period simple moving average (SMA) of prices, depicted as histograms aligned above or below a zero reference point.
The Moving average convergence divergence (MACD) is a trend-following momentum indicator that reveals the connection between two moving averages of price.
Easy Installation
Start using this forex strategy in just 5 minutes. Click here to get started now.