The average directional index (ADX) forex strategy is a forex trading strategy that gauges the strength of a trend not minding if we are in an upward or downward market.
The strategy combines the !De_Munyuk and ADX custom indicators to spot trend and also measure its strength.
The strategy as adopted to aid traders properly evaluate trends, thereby picking the strongest, as such maximizing profits.
Chart Setup
MetaTrader4 Indicators: !De_Munyuk.ex4 (default setting), Average Directional Index.ex4 (ADX) (default setting)
Preferred Time Frame(s): 5-Minutes, 15-Minutes, 30-Minutes, 1-Hour, 4-Hours, Day, Week
Recommended Trading Sessions: Any
Currency Pairs: Any pair
Download
Download Average Directional Index (ADX) Forex Strategy
Buy Trade Example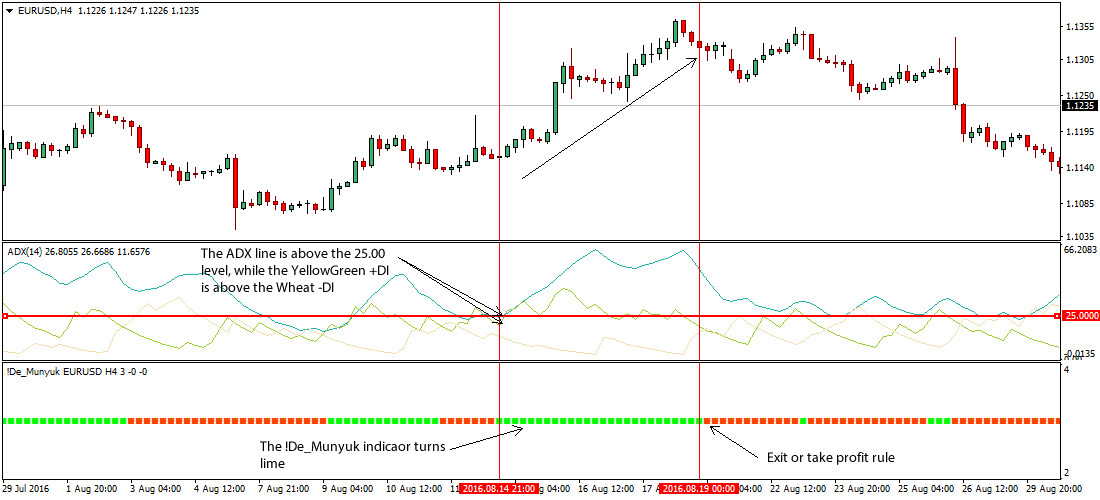
Fig. 1.0
Strategy
Long Entry Rules
Enter a buy position if the following conditions or rules are in place:
- If the !De_Munyuk indicator turns lime, it denotes that price is bullish, but traders should confirm the signal from the Average Directional Index (ADX) in number condition #2.
- If the ADX line is above the 25.000 level (it denotes a strong trend), while the +DI line is above the –DI, a move that signals that price is bullish.
Stop Loss for Buy Entry: Place stop loss 2 pips below support.
Exit Strategy/Take Profit for Buy Entry
Exit or take profit on position(s) if the following rules hold true:
- If the !De_Munyuk indicator color turns OrangeRed, it is a signal that the current trend is reversing and profits on position(s) should be locked in.
- If the ADX line falls below the 20.000 level, it indicates the absence of any trend whatsoever and traders are advised to exit or take profit on position(s) entered.
Sell Entry Rules
Enter a sell in the market if the following rules hold sway:
- If the !De_Munyuk indicator turns OrangeRed, it is a signal that price is declining i.e. a bearish signal and a further confirmation from the Average Directional Index (ADX) indicator is required before initiating sell order(s).
- If the ADX line is above the 25.000 level (it denotes a strong trend), while the –DI (wheat colored) line is above the +DI (YellowGreen), a bearish trend is triggered.
Stop Loss for Short Entry: Place stop loss 2 pips above resistance.
Exit Strategy/Take Profit for Short Entry:
Exit or take profit on position(s) if the following conditions are observed:
- If the !De_Munyuk indicator turns Lime, it indicates that the existing trend is making a turn and as such an exit or take profit is advised.
- If the ADX line falls below the 20.0000 level, it is an indication that no trend is present in the market or if the +DI line crosses above the –DI line, an exit or take profit should be initiated.

Fig. 1.1
Free Download
Download the Average Directional Index (ADX) Forex Strategy
About The Trading Indicators
The !De_Munyuk custom indicator is a lagging indicator that is used to spotting buy and sell signals in the market.
Its color scheme allows it define a buy and sell in the market using lime and OrangeRed colors.
The Average Directional Index (ADX) indicator is comprised of the ADX, Plus Directional Indicator (+DI) and Minus Directional Indicator (-DI).
It forms the trading system that was created by Welles Wilder.
The ADX line shows the strength of a trend, while plus Directional Indicator (+DI) and Minus Directional Indicator (-DI) defines the direction of the trend.