The Bollinger Bands With MACD Forex Strategy is designed to be more flexible in adapting to ever-changing market conditions.
A criteria that every currency trader must possess in order to profit from forex market volatility.
Moreover, this strategy helps traders avoid confusion when market conditions becomes unclear.
Considering the increasing imponderable nature of the forex market, traders are required to become more flexible with their approach and this strategy seeks to offer you that style.
Chart Setup
MetaTrader4 Indicators: bollinger-squeeze-with-macd.ex4 (Inputs Variable Modified; triggerType=4), r-gator-indicator;ex4 (Inputs Variable Modified; period=10, period_1=16, period_2=26, bars=30000, Colors Width Modified; #0=2, #1=2, #2=2)
Preferred Time Frame(s): 1-Minute, 5-Minute, 15-Minutes, 30-Minutes, 1-Hour, 4-Hours, 1-Day, 1-Week
Recommended Trading Sessions: Any
Currency Pairs: Any pair
Download
Download the Bollinger Bands With MACD Forex Strategy
Buy Trade Example

Fig. 1.0
Strategy
Long Entry Rules
Enter a bullish trade if the following indicator or chart pattern gets put on display:
- If the lime & blue histograms of the bollinger-squeeze-with-macd Metarader 4 forex indicator stay above the 0.00 signal level (see Fig. 1.0), price is said to be pushed higher i.e. a trigger to buy the stipulated forex pair.
- If the blue line of the r-gator-indicator crosses the red and green line in a bottom up manner as depicted on Fig. 1.0, bulls are said to be driving price higher, therefore a buy order will suffice.
Stop Loss for Buy Entry: Place stop loss 3 pips below trading support.
Exit Strategy/Take Profit for Buy Entry
Exit or take profit from all trades if the following rules or conditions takes precedence:
- If while a bullish trend is ongoing, the bollinger-squeeze-with-macd custom indicator pops up a blue histogram that’s aligned beneath the 0.00 signal level, bulls power is said to be weaning, thus an exit or take profit is duly advised.
2, If the blue line of the r-gator-indicator crosses the green & red lines to stay above them while a bullish trend is running, traders are advised to reduce exposure on their long positions, most likelyban exit or take profit will do.
Sell Entry Rules
Go short if the following setups gets displayed rightly on the activity chart:
- If the red & blue histograms of the bollinger-squeeze-with-macd custom indicator stay below the 0.00 signal level (refer to Fig. 1.1), price is said to be dragged lower i.e. a trigger to sell the designated currency pair.
- If the blue line of the r-gator-indicator crosses the red and green line in a top downward fashion as shown on Fig. 1.1, bears are said to be dragging price lower, hence a trigger to go short on the currency pair of focus.
Stop Loss for Sell Entry: Place stop loss 3 pips above trading resistance.
Exit Strategy/Take Profit for Sell Entry
Exit or take profit if the following takes center stage:
- If while a bearish trend is running, the bollinger-squeeze-with-macd custom indicator pops up a lime histogram that’s positioned above the 0.00 horizontal level, a bearish reversal is said to be looming, therefore an exit or take profit is recommended.
2, If the blue line of the r-gator-indicator crosses the red & green lines to stay beneath them while a bearish trend is running, traders are advised to minimize their sell positions i.e. a trigger to exit or take profit forthwith.
Sell Trade Example
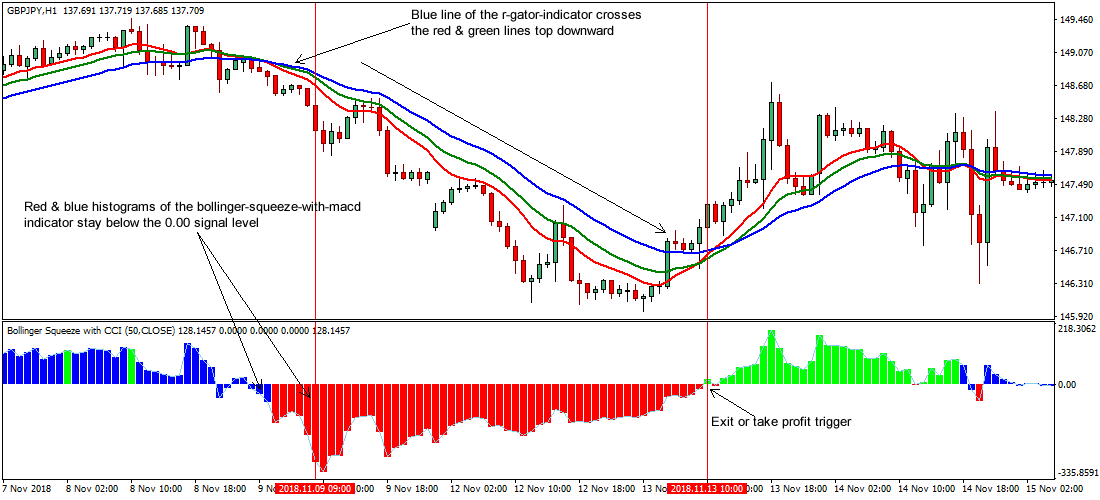
Fig. 1.1
Free Download
Download the Bollinger Bands With MACD Forex Strategy
About The Trading Indicators
The bollinger-squeeze-with-macd.ex4 custom indicator is built on signals from the stochastics, cci, rsi, macd and Bollinger Bands indicator.
It is used to gauge trend direction, along with price volatility.
The r-gator-indicator.ex4 is known to take after the Alligator MT4 indicator (as they show comparable values for the MA periods).
However, the r-gator-indicator produces its signal a bit earlier than the Alligator.