When forex traders skim the market for small profits on a consistent basis, they obviously know they are doing this to grab small profits in any possible manner as many times as they possibly can.
I have designed a very modest forex strategy with elementary indicators that can be applied to low spread currency pairs. Ensure that you use them only on the M1, M5, or M15 trading charts.
Chart Setup
MetaTrader 4 Indicators: dsl_-_DMI_oscillator.ex4 (default setting), HAMA_.ex4 (default setting)
Preferred Time Frame(s): 1-Minute, 5-Minute, 15-Minute
Recommended Trading Sessions: New York Open | London Open
Currency Pairs: Any low spread forex pair, for example EUR/USD
Download
Download the DMI Oscillator Forex Trading Strategy
Buy Trade Example

Fig. 1.0
Strategy
Long Entry Rules
Initiate a buy entry if the following conditions or rules are in place:
- If the royal blue bars of the HAMA_ custom indicator aligns itself below the candlesticks as shown on Fig. 1.0, price is said to be pressured higher i.e. a buy signal. The wider the distance between the price bar and the HAMA_ indicator.ex4, the stronger the trend.
- If the lines (dotted & filled) of the dsl_-_DMI_oscillator.ex4 breaks above the 0.00 signal level, price is said to be bullish i.e. a buy signal. At points in which the filled line turns lime green, it is a representation of a strong bullish signal.
Stop Loss for Buy Entry: Place stop loss below immediate support or below the blue HAMA bars.
Exit Strategy/Take Profit for Buy Entry
Exit or take profit on position if the following chart or indicator patterns are on display:
- If the bars of the HAMA_ .ex4 custom indicator turns red, realigning itself somewhat above the candlesticks, it is a trigger to exit or take profit accordingly.
- If the lines (dotted & filled) of the dsl_-_DMI_oscillator.ex4 breaks below the 0.00 signal level, it is an indication that bulls are exiting or closing their orders, as such an exit or take profit is recommended.
Sell Entry Rules
Enter a sell order if the following indicator or chart pattern gets shown:
- If the red bars of the HAMA_.ex4 custom indicator aligns itself above the candlesticks as shown on Fig. 1.1, price is said to be pushed lower i.e. a sell signal. The wider the distance between the price bar and the HAMA_.ex4 indicator, the stronger the trend.
- If the lines (dotted & filled) of the dsl_-_DMI_oscillator.ex4 pushes below the 0.00 signal level, price is said to be bearish i.e. a sell signal. At levels in which the filled line turns orange red, it is a sign of a strong bearish signal.
Stop Loss for Sell Entry: Place stop loss above immediate resistance or above the red HAMA bars.
Exit Strategy/Take Profit for Sell Entry
Exit or take profit if the following indicator or chart pattern gets displayed:
- If the bars of the HAMA_.ex4 custom indicator turns royal blue, realigning itself somewhat below the candlesticks, it is a trigger to exit or take profit accordingly.
- If the lines (dotted & filled) of the dsl_-_DMI_oscillator.ex4 breaks above the 0.00 signal level, it is an indication that sellers are closing their position(s) in the market, as such an exit or take profit is recommended.
Sell Trade Example
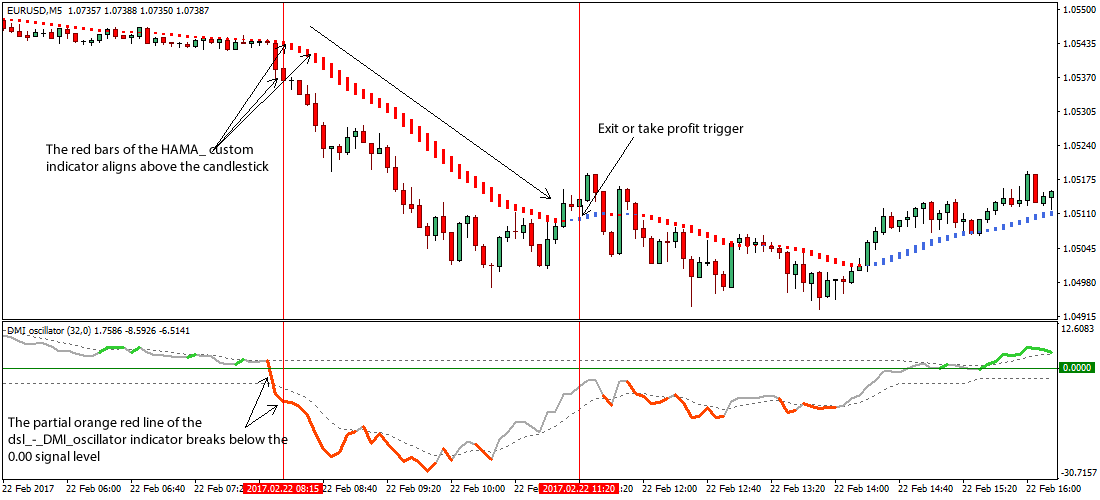
Fig. 1.1
Free Download
Download the DMI Oscillator Forex Trading Strategy
About The Trading Indicators
The HAMA_.ex4 custom indicator is a trend following indicator that enables a 2-color visualization i.e. blue and red to signal buy and sell signals respectively.
The dsl_-_DMI_oscillator.ex4 on the other hand is a DMI oscillator version of dsl (discontinued signal lines) and can be used both in trend and counter trend trading, while the dsl in this case does add to momentum strength estimation.