The enhanced forex trading strategy is an improved trading strategy that combines the 1SSRC custom indicator with the EMA (14) and EMA (24).
The strategy is trend seeking and performs better during sessions of high volume trading.
Chart Setup
MetaTrader4 Indicators: 1SSRC.ex4 (default setting), Exponential Moving Average (14), Exponential Moving Average (24)
Preferred Time Frame(s): 1-Minute, 5-Minutes, 15-Minutes, 30-Minutes, 1-Hour, 4-Hours
Recommended Trading Sessions: London Open | New York Open
Currency Pairs: any
Download
Download the Enhanced Forex Trading Strategy
Buy Example (Click the image for full size)

Fig. 1.0
Strategy
Long Entry Rules
Enter a long position when the following chart or indicator patterns play out:
- If the 1SSRC custom indicator hovers or sits above the 0.00 level, it is considered to be a bullish signal (refer to Fig. 1.0, the enclosed area between the two vertical red lines represents our bullish zone).
- If the red EMA (14) line crosses the blue EMA (24) upwards and a bullish candle closes above the lines, it means we’re in for a bulls market.
Stop Loss for Long Entry: Set stop loss below the most recent support level.
Exit Strategy/Take Profit for Long Entry
The following rules or conditions are indicative of an exit or take profit:
- If the 1SSRC custom indicator plunges below the 0.00, it is a call towards an exit or take profit.
- If a bearish candle closes below the blue EMA (24), it is an indication that a reversal is underway and as such an exit or take profit is imminent.
Sell Entry Rules
Place a sell order when the following rules are in place:
- If the 1SSRC custom indicator falls below the 0.00 level, it denotes a sell signal. The enclosed area between the 2 red vertical lines represents this region and thus support a bear market.
- If the red EMA (14) line crosses the blue EMA (24) downwards, a bearish trend is underway.
Stop Loss for Sell Entry: Set stop loss above the most recent resistance level.
Exit Strategy/Take Profit for Sell Entry
Exit or take profit on position(s) based on the following rules:
- If the lime line of the 1SSRC custom indicator pushes above the 0.00 level, it is a sign that price is reversing, making it imperative for an exit or take profit.
- If a bullish candle closes above the red EMA (14) and blue EMA (24) lines, it is a nod for an exit or take profit.
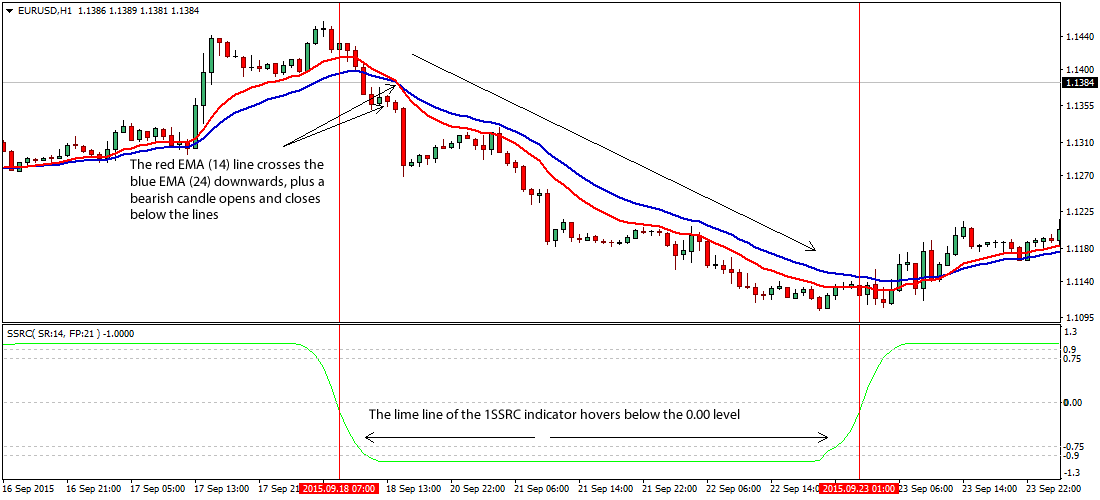
Fig. 1.1
Free Download
Download the Enhanced Forex Trading Strategy
About The Trading Indicators
The 1SSRC.ex4 MT4 custom indicator oscillates between 1.3 and -1.3 levels. The 1.3 level indicates a strongly overbought condition, while the -1.3 indicates a firmly oversold region. The indicator has its mid-point reference set at 0.00.
The Exponential Moving Averages i.e. the EMA (14) and EMA (24) are in a lot ways similar to simple moving averages, asides that more weight is given to the most recent data. This implies that the SMAs react more rapidly to recent price changes than the SMAs.