Forex traders are known to use Fibonacci tools to identify where to place orders for market entry, as well as taking profits and stop loss orders.
Moreover, traders tend to use Fibonacci levels to spot and trade off support and resistance areas.
We have designed the Fibonacci Bands Forex strategy to do a little bit more than that by also spotting significant upward or downward price movement.
We have stripped out six lines from our main trading indicator in a bid to simplify things for you.
The need to add 2 other technical indicators became imperative to ensure smooth confirmation of the buy/sell trade signals.
Otherwise, you might trade in the wrong direction.
Let checkout how to make sense out of everything.
Chart Setup
MetaTrader4 Indicators: bands-fibo-true.ex4 (Colors Modified; #1=None, #2=None, #3=None, #4=None, #5=None, #6=None), dat-cloud-indicator.ex4 (Default Setting), coppock.ex4 (Inputs Variable Modified; ROC1Period=28)
Preferred Time Frame(s): 1-Minute, 5-Minute, 15-Minutes, 30-Minutes, 1-Hour, 4-Hours, 1-Day, 1-Week
Recommended Trading Sessions: Any
Currency Pairs: Any pair
Download
Download the Fibonacci Bands Forex Strategy
Buy Trade Example

Fig. 1.0
Strategy
Long Entry Rules
Enter a bullish trade if the following indicator or chart pattern gets put on display:
- If the corn flower blue cloud of the dat-cloud-indicator intersects the blue dotted line of the bands-fibo-true Metatrader 4 forex indicator in a bottom up fashion with price trading above (see Fig. 1.0), then we can say that the overall market sentiment is somewhat bullish, therefore a buy order will suffice.
- If the red histograms of the coppock custom indicator hovers above the 0.00 signal level as illustrated on Fig. 1.0, price is said to be pressured to the upside i.e. a trigger to go long on the designated currency pair.
Stop Loss for Buy Entry: Place stop loss below support.
Exit Strategy/Take Profit for Buy Entry
Exit or take profit from all trades if the following rules or conditions takes precedence:
- If the corn flower blue cloud of the dat-cloud-indicator intersects the blue dotted line of the bands-fibo-true indicator to stay above it, then a bearish reversal is said to be looming, therefore an exit or take profit is advised.
- If during a bullish signal the coppock custom indicator pops up a red histogram that stays below the 0.00 signal level as exemplified on Fig. 1.0, it is a trigger to exit or take profit forthwith.
Sell Entry Rules
Go short if the following setups gets displayed rightly on the activity chart:
- If the violet cloud of the dat-cloud-indicator intersects the blue dotted line of the bands-fibo-true indicator in a top downward manner with price trading below (refer to Fig. 1.1), then it is okay to say that the general market sentiment is fairly bearish, thus a trigger to go short.
- If the red histograms of the coppock custom indicator hovers below the 0.00 signal level as exemplified on Fig. 1.1, price is said to be pushed lower, as such a trigger to go short on the selected forex pair.
Stop Loss for Sell Entry: Place stop loss above resistance.
Exit Strategy/Take Profit for Sell Entry
Exit or take profit if the following takes center stage:
- If the violet cloud of the dat-cloud-indicator intersects the blue dotted line of the bands-fibo-true indicator to stay below it, then a bullish reversal is said to be on the horizon, therefore an exit or take profit is recommended.
- If during a bearish signal the coppock custom indicator pops up a red histogram that stays above the 0.00 signal level as shown on Fig. 1.1, it is a trigger to exit or take profit without delay.
Sell Trade Example
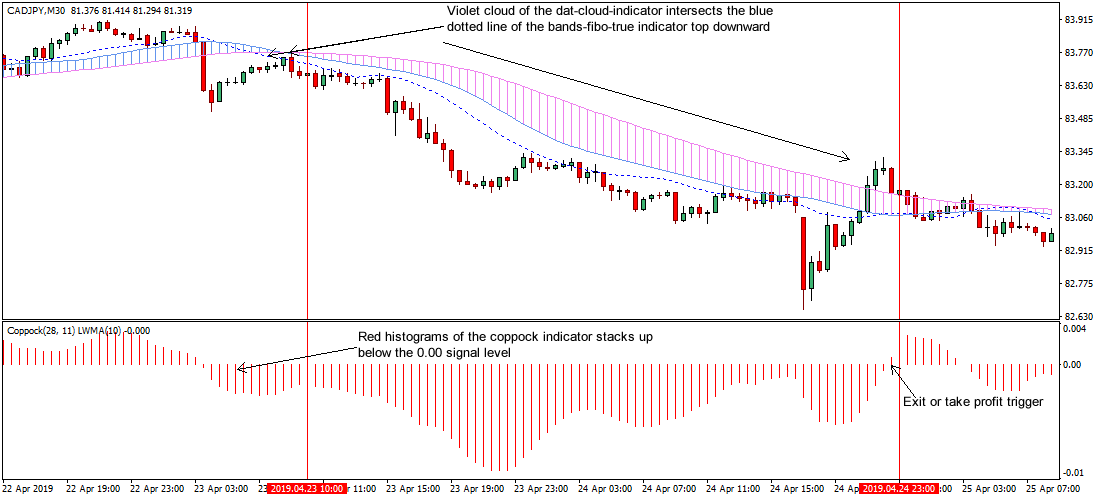
Fig. 1.1
Free Download
Download the Fibonacci Bands Forex Strategy
About The Trading Indicators
The bands-fibo-true.ex4 is a technical indicator that uses the ATR along with series of bands wrapped around price to create support and resistance levels.
The dat-cloud-indicator.ex4 uses the popular Ichimoku (Tenkan, Kijun & Senkou) and a simple moving average indicators to define the various properties of price (trend, momentum and reversal) while trading.
The Coppock custom indicator is a technical study that is built on three different Moving Averages i.e. Exponential, Linear Weighted, and the Simple Moving Averages.