Forex candlesticks has remained a vital tool traders use to analyze price charts and confirm current trade setups.
Japanese rice traders have exploited the candlesticks for decades before it eventually made its way to the trading markets via Steve Nilson’s books.
Our Forex Candlestick strategy for Metatrader 5 takes advantage of an accurate buy/sell colored candlestick indicator that works together with the DeMarker overbought/oversold oscillator.
You’ll get to see a simple, yet efficient way to trade candlesticks for long-term profits.
More so, our strategy will ultimately allow traders understand the sentiment that drives a specific market and by the time you’re done here you’ll know how to spot lucrative formations.
Trade Setup
MetaTrader 5 Indicators: DeMarker.ex5 (Parameters Modified; Period=28), 4_ma_candles.ex5 (Inputs Variable Modified; Average period=28, Average method=Simple moving average)
Trade Style: Scalping, day trading, swing trading
Trading Sessions: London | New York | Tokyo
Currency Pairs: Majors, cross pairs, exotics
Platform: Metatrader 5 (MT5)
Download
Download the Forex Candlestick Strategy For Metatrader 5
Buy Trade Example: EURGBP, H1 Chart
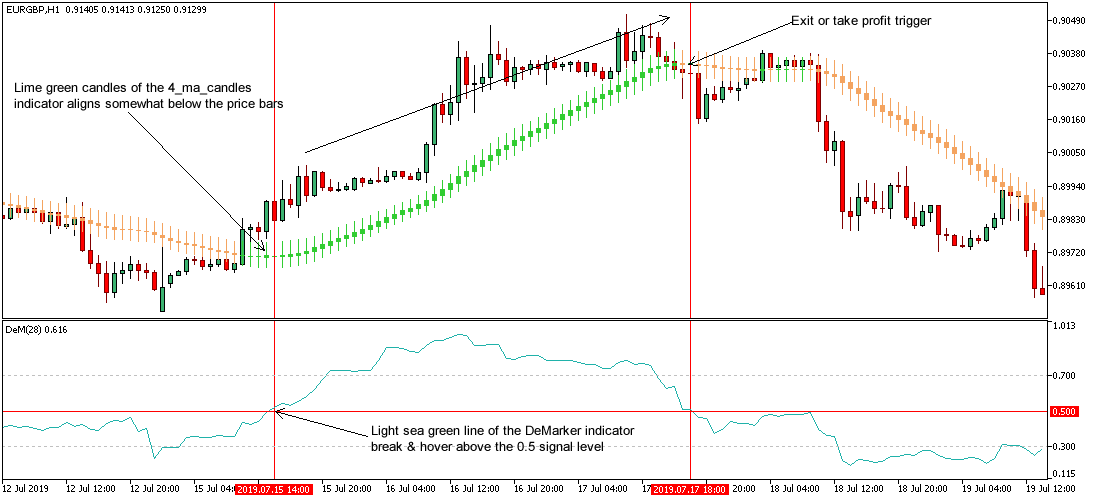
Fig. 1.0
Trading Strategy Rules For Buy and Sell Trades Explained
Buy Entry
Enter a buy trade if the following trading conditions are met:
- If the light sea green line of the DeMarker Metatrader 5 indicator breaksand hovers above the 0.5 horizontal level as illustrated on Fig. 1.0, price is said to be driven to the upside i.e. a trigger to go long on the stipulated currency pair.
- If the lime green candles of the 4_ma_candles forex indicator align somewhat below the price bars as depicted on Fig. 1.0, the overall market sentiment is said to be bullish i.e. a trigger to buy the under listed forex pair.
Suggested Stop Loss for Buy Entry: Place stop loss below key support.
Suggested Exit Strategy/Take Profit for Buy Trade
Exit the buy trade if the following trading conditions are met:
- If the light sea green line of the DeMarker forex indicator dips below the 0.5 signal level during the course of a bullish signal, it is pointing to diminishing bulls power, as such an exit or take profit will do.
- If while a bullish trend is running, the 4_ma_candles indicator pops up a sandy brown candle on the activity chart as seen on Fig. 1.0, bulls power is said to be weaning, therefore an exit or take profit stance is recommended.
Sell Entry
Open a sell trade if the following trading conditions are met:
- If the light sea green line of the DeMarker indicator breaksand hovers below the 0.5 horizontal level as shown on Fig. 1.1, price is said to be pressured lower i.e. a trigger to sell the designated forex pair.
- If the sandy brown candles of the 4_ma_candles forex indicator align slightly above the price bars as exemplified on Fig. 1.1, the general market sentiment is said to be bearish, as such a sell alert will suffice.
Suggested Stop Loss for Sell Entry: Place stop loss above key resistance.
Suggested Exit Strategy/Take Profit for Sell Entry
Exit the sell trade if the following trading conditions are met:
- If the light sea green line of the DeMarker forex indicator surges above the 0.5 horizontal level while a bearish signal is ongoing, it is signaling the likely end in bears price strength, as such an exit or take profit is advised.
- If the 4_ma_candles indicator pops up a lime green candle during a bearish trend as seen on Fig. 1.1, bears power is said to be halting, therefore an exit or take profit stance is duly recommended.
Sell Trade Example: EURGBP, H1 Chart
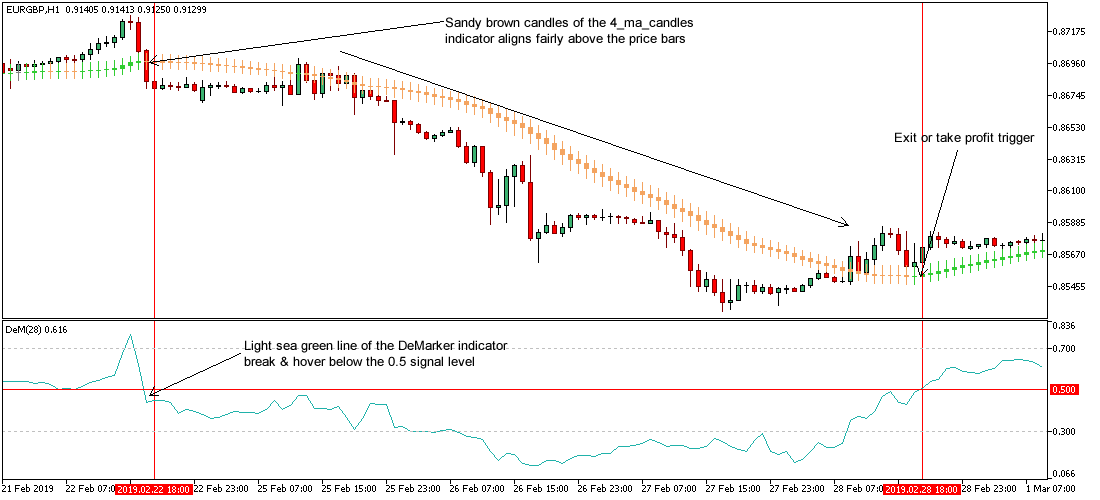
Fig. 1.1
Free Download
Download the Forex Candlestick Strategy For Metatrader 5
MT5 Trading Indicators Used For This Strategy
The DeMarker indicator is an oscillator designed by Tom Demark that also finds use when traders are trying to determine potential overbought and oversold regions in the market.
The 4_ma_candles custom indicator is by default a 25-period exponential moving average that deploys colored candles as a way of showing bullish and bearish market sentiment.