The Forex Gold strategy is based on trade logic that truly works and tells traders when precisely to get into Gold buy/sell trades on nearly every time frame.
It’s a simple trend following strategy that is built around the 36 period exponential Moving Average (36 EMA) and the DMI oscillator.
Asides Gold, this strategy can work with any forex pair.
Chart Setup
MetaTrader4 Indicators: DynamicRS_C.ex4 (Inputs Variable Modified; IPeriod=20), 36 period exponential Moving Average.ex4 , dsl_-_DMI_oscillator.ex4 (Default Setting)
Preferred Time Frame(s): 1-Minute, 5-Minute, 15-Minute, 30-Minute, 1-Hour, 4-Hour, 1-Day, 1-Week, 1-Month
Recommended Trading Sessions: Any
Currency Pairs: Gold + Any pair
Download
Download the Forex Gold Strategy
Buy Trade Example: GOLD (XAU / US Dollar), H1 Chart

Fig. 1.0
Strategy
Long Entry Rules
Initiate a buy entry if the following indicator or chart pattern gets put on display:
- If the blue 36 EMA indicator line crosses below the multi-colored DynamicRS_C indicator line as shown on Fig. 1.0, price is said to be driven to the upside, therefore a buy alert will suffice.
- If the multi-colored line of the dsl_-_DMI_oscillator indicator breaksabove the zero horizontal level as depicted on Fig. 1.0, the general market sentiment is said to be bullish, as such a buy trigger will do.
Stop Loss for Buy Entry: Place stop loss below support.
Exit Strategy/Take Profit for Buy Entry
Exit or take profit if the following rules or conditions takes precedence:
- If while a bullish trend is running, the blue 36 EMA indicator line intersects the multi-colored DynamicRS_C indicator line (see Fig. 1.0), it is pointing to diminishing bulls power, hence a signal to exit or take profit immediately.
- If the multi-colored line of the dsl_-_DMI_oscillator indicator dips below the 0.00 reference level during the course of a bullish trend, it an indication of weaning bulls power, as such an exit or take profit stance is recommended.
Sell Entry Rules
Enter a sell order if the following holds true:
- If the blue 36 EMA indicator line crosses above the multi-colored DynamicRS_C indicator line as illustrated on Fig. 1.1, price is said to be dragged lower, therefore a sell alert will do.
- If the multi-colored line of the dsl_-_DMI_oscillator indicator dips & runs below the zero reference level as exemplified on Fig. 1.1, the overall market sentiment is said to be bearish, thus a signal to go short on the selected forex pair.
Stop Loss for Sell Entry: Place stop loss above resistance.
Exit Strategy/Take Profit for Sell Entry
Exit or take profit if the following takes center stage:
- If while a bearish trend is ongoing, the blue 36 EMA indicator line intersects the multi-colored DynamicRS_C indicator line (refer to Fig. 1.1), bears are said to be closing their positions increasingly, therefore an exit or take profit stance is advised.
- If the multi-colored line of the dsl_-_DMI_oscillator indicator readjust to spike above the 0.00 reference level while a bearish trend is on course, it an indication of halting bears power, hence a trigger to exit or take profit at once.
Sell Trade Example: GOLD (XAU / US Dollar), H1 Chart
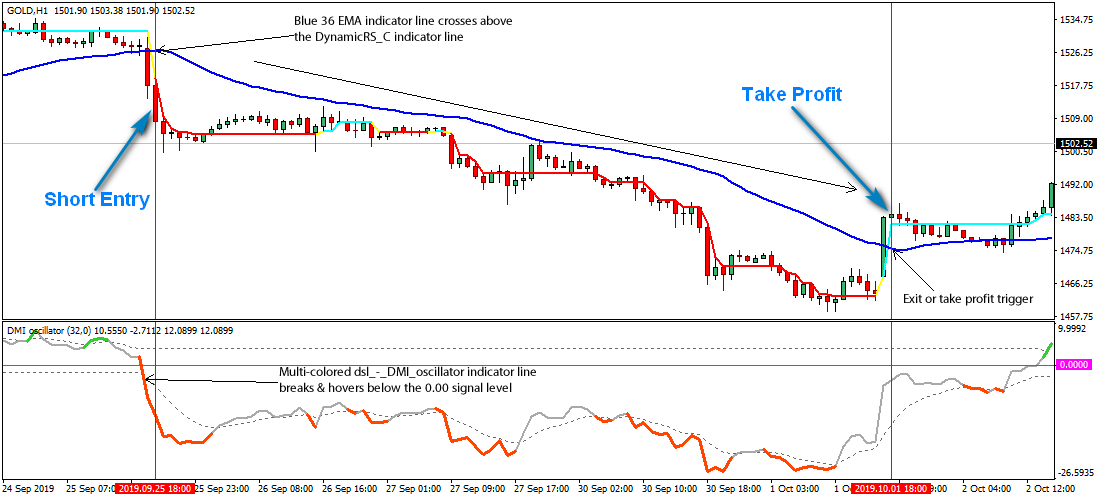
Fig. 1.1
Free Download
Download the Forex Gold Strategy
About The Forex Technical Indicators Used
The DynamicRS_C is a trend following indicator that shows price change.
When the line of indicator is painted red, it denotes a bearish signal while aqua depicts bullish market sentiment.
The yellow filled segment reveals periods of market indecision.
The 36 EMA is an exponential moving average that has its period set at 36 and reduces the lag by adding more weight to recent price.
The dsl_-_DMI_oscillator is a DMI oscillator version of dsl (discontinued signal lines) and can be used both in trend and counter trend trading but the dsl component is known to add to momentum strength estimation.
Easy Installation
Start using this Gold strategy in just 5 minutes. Click here to get started now.