A technical analysts named J. Welles Wilder developed the Relative Strength Index or RSI, as a tool that aids in identifying overbought and oversold market conditions.
The RSI indicator is scaled from 0 to 100 thereby making it uniquely similar to the stochastic indicator.
It is a widely used technical indicator that exhibits overbought conditions when it oscillates above the 70 level, and oversold condition is on display when its readings gets under 30.
There are some traders who go for extreme readings of 80 and 20 to depict these conditions.
RSI readings that are above the 85 level are interpreted as strong overbought conditions, while reading below the 15 level are tagged strong oversold conditions.
One of the drawbacks associated with using the RSI is that unexpected, sharp price movements can result in upward or downward spikes, as such the likelihood of false signals is high.
Moreover, it is common for price to stretch well beyond the initial level where the Relative Strength Index first spotted an overbought or oversold condition.
This is one reason why any strategy that deploys the RSI shouldn’t be in isolation, but rather in combination with other technical indicators.
The default settings for the RSI indicator is a smoothing 14 period and we can decide to modify it to our preferred value.
Ensure you check out these settings on the RSI before you delve into any strategy.
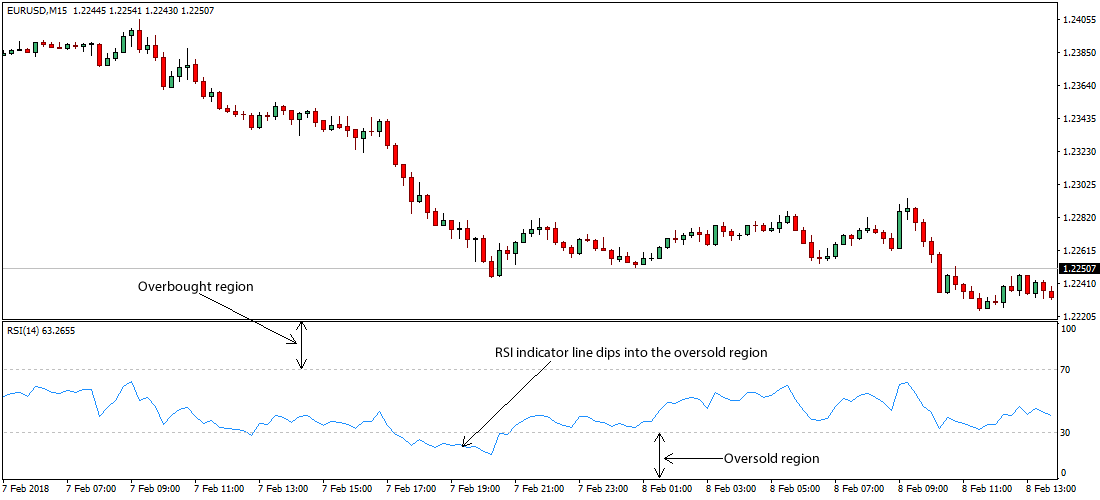
Fig. 1.0
The Relative Strength Index is represented by the following formula:
RS = Average of ‘N’ day’s closes UP/Average of ‘N’ day’s closes DOWN
The first part of formula derives the initial Relative Strength (RS) value, which is proven to be the ratio of the average UP closes to the average DOWN closes over a specified period ‘N’.
The real RSI value is computed by indexing the indicator to 100 via the use of the following mathematical principle:
RSI = 100 – (100 /1 + RS)
Understanding Basic RSI Signals
Hey are some of the ways in which we can best use the RSI indicator:
1. RSI Safe Levels
The RSI indicator in its default settings comes preloaded with marked levels at the 70 and 30 point area.
The implication of these levels are simple – if the RSI gets below the 30 mark, it is said to signal oversold market conditions i.e. a trigger to go long on the desired forex pair.
While an RSI reading of 70 and above indicates an overbought market condition, as such a sell trigger will suffice.
We can also consider the 50 level as the midline that separates the upper and lower zones, which can be categorized as bullish (above 50) and bearish (below 50) zones.
2. RSI 2 Period Crossover
Add the short 5 period (RSI 5) over the default longer RSI 14 and spot the crossover (see Fig. 1.1).
As a matter of fact, there are instances where we get to see the RSI 14 (dodger blue line) unable to reach the oversold or overbought region before redirecting.
We decided on using the shorter RSI 5 indicator due to the fact that it is more reactive to current changes in price, hence it is inclined to showing early reversal signals.
If the RSI 5 crosses above the RSI 14 within the oversold region (or when the lines are above the 50.00 level), it is a signal to go long on the desired currency pair.
We added the 200 Simple Moving Average to offer us a viable support/resistance price level.
Alternatively, when the RSI 5 crosses below the RSI 14 in the overbought region (or when the lines are below the 50.00 level), a bullish signal is said to be triggered.
Some seasoned forex traders greatly enhance their performance by combining the RSI trading strategy with Pivot Points.

Fig. 1.1
3. RSI Trendlines
Plotting trendlines within the Relative Strength Index window makes use of traditional price action techniques that we have discussed within our “Price Action” category.
As a refresher, link the tops and bottoms within the RSI indicator window and wait for the trendline break as a viable trade signals.
In order to obtain a rising trendline, link three or more points on the RSI line as it surges.
A declining trendline is plotted by linking three or more points on the RSI line as it dips.
If an RSI trendline gets tested and breaks, it is an indication of a possible price reversal or continuation.
It is a fact that the break of an RSI trendline frequently pave the way for the break of a trendline on the activity chart, thereby delivering an early notice and a very timely opportunity to place orders.
4. RSI Standard Divergence
The RSI indicator can deliver trends based on its divergences, which are visible when lower highs forms, while corresponding higher highs gets displayed on the price chart – thereby producing an RSI bearish divergence.
RSI divergence are known to form at the peak of bullish markets, and gets tagged reversal pattern.
Nothing short of reversals are expected when RSI divergence gets shown on the chart.
It is a reversal warning that precedes the candlesticks that will hold the likely trend reversal i.e. just before price dips below its support line (in support of a bearish signal).
On the contrary, the bullish RSI divergence gets displayed when price depicts lower lows and the RSI indicator is up for higher lows.
As an advanced warning signal, the trend direction is billed to alter from downwards to upwards.
The higher timeframes like the H4 & D1 are well suited for trading RSI divergence.
RSI trading strategies for scalpers
If you wish to scalp the market using the RSI indicator, it is wise to pick the 1-minute and/or 5-minute chart for use to determine buy/sell market signals.
Our favorite setting for use is the RSI 5 which is set to oscillate between the 80 and 20 levels, also tagged the overbought and oversold regions.
The RSI scalping strategy is flexible and allows for profit trailing.
Using the RSI 5 increases the indicator’s sensitivity to market pressures and a price filter of 150 SMA can be added to spot bullish or bearish market signals.
Considering the setup, if price break below the 150 SMA, a sell alert is advised and a bullish signal from the RSI indicator confirms the earlier warning when the indicator break above the 90.00 level.
Checkout our RSI forex trading strategy here for more insights.
RSI trading strategies for day traders
The key for day traders who deploy the RSI trading strategy is to determine trading setups that assess support and resistance levels, taking into account the market structure, while concentrating on premium quality trading setups.
For this purpose, the default RSI 14 periods works well for day traders.
A lot of intraday traders find it lacking, as a result of its scarce trading signals.
This problem is sometimes solved by some traders through the lowering of the period settings on the RSI indicator.
They do this in order to get the indicator to become more sensitive. Some traders will go as far as lowering their timeframe.
Nonetheless, we tend to get signals that are increasingly unreliable deploying these solutions.
Day traders are not really mindful of getting infrequent trades, especially when such trades are the high-quality ones.
You can click here for a “Day Trading Strategy” example using the RSI indicator.
RSI trading strategies for swing traders
When swing trading using the RSI indicator, you should start off by spotting your support as well as resistance levels.
This implies that you should be able to interpret charts to determine the regions within the chart where there is some resistance or support.
An RSI Period of 10 and above is ideal for use when scanning the market for entry.
Swing traders can deploy this setting when investigating short signals – if the market may be in an overbought or oversold territories.
Check out this RSI indicator swing trading example to get a head start.
Conclusion
Using the Relative Strength Index indicator makes it easy to jump into forex trading as a novice.
This has made the RSI one of the most widely used technical indicators.
Once you’re able to grasp the RSI indicator, you’ll then be able to fully appreciate its signals i.e. when price is trending, it could sway to the overbought or oversold region.
The RSI indicator is able to tell when it is most suitable to enter or exit a trade.
It can also help in determining the trading timeframe that is most active.
Risk management is key when trading with the RSI indicator – as trends can form ranges and prices are able to go against the trader for a protracted time.
The use of stops is something we encourage when traders incorporate the RSI indicator into their trading strategy.
This is because despite the fact that a sell or buy trigger is happening, price could continue to trend higher or lower as the case may be.
Patience is required when it comes to dealing with the RSI indicator.
This is because the skills needed in interpreting and understanding the RSI triggers must be developed over time and combining the indicator with another technical tool is always recommended.