The low volatility forex trading strategy is designed to capture the best trading opportunities during low volatility market periods.
In order to get this done, we are employing volatility tracking tools like Bollinger Bands and other volatility sensitive technical indicators.
We’ll be tracking low volatility conditions until they pick up steam, with a lookout for breakout opportunities
The strategy works for any currency pair and time frame with good success rate.
Chart Setup
MetaTrader 4 Indicators: Bollinger Bands.ex4 (Default Setting), BBalert_Arrows.ex4 (Inputs Variable Modified; SignalGap=12, Colors Modified; #0=Blue, #1=Red), BBWin.ex4 (Colors Modified; #6=None)
Preferred Time Frame(s): 1-Minute, 5-Minute, 15-Minute, 30-Minute, 1-Hour, 4-Hour, 1-Day, 1-Week, 1-Month
Recommended Trading Sessions: Any
Currency Pairs: Any pair
Download
Download the Low Volatility Forex Trading Strategy
Buy Trade Example: AUD/USD (Australian Dollar / US Dollar), M15 Chart

Fig. 1.0
Strategy
Long Entry Rules
Initiate a buy entry if the following indicator or chart pattern gets put on display:
- If price breaks above the middle medium sea green line of the Bollinger Bands Metatrader 4 indicator as seen on Fig. 1.0, price is said to breakout higher from a probable low volatility condition, as such a buy alert is duly recommended.
- If the red upward pointing arrow of the BBalert_Arrows custom indicator gets aligned slightly below the price bars as shown on Fig. 1.0, the general market sentiment is said to be bullish, therefore a buy alert is imminent.
- If the red line and black histograms of the BBWin forex indicator break above the zero horizontal level as depicted on Fig. 1.0, bulls are said to be driving market sentiment i.e. a signal to buy the stipulated currency pair.
Stop Loss for Buy Entry: Place stop loss below the lower Bollinger Band or below the previous swing low.
Exit Strategy/Take Profit for Buy Entry
Exit or take profit if the following rules or conditions takes precedence:
- If price falls to close below the medium sea green middle line of the Bollinger Bands indicator during the course of a bullish trend, bulls are said to be leaving the market increasingly, as such an exit or take profit stance will suffice.
- If the BBalert_Arrows indicator pops up a blue downward pointing arrow while a bullish trend is ongoing (see Fig. 1.0), price is said to be making a likely bearish reversal, thus an exit or take profit is advised.
- If the red line of the BBWin indicator dips below the 0.00 reference level while a bullish trend is running, more and more bulls are said to be closing their positions, thus a trigger to exit or take profit at once.
Sell Entry Rules
Enter a sell order if the following holds true:
- If price breaks below the middle medium sea green line of the Bollinger Bands forex indicator as illustrated on Fig. 1.1, price is said to breakout lower from a probable low volatility condition, hence a sell is duly advised.
- If the blue downward pointing arrow of the BBalert_Arrows custom indicator gets aligned fairly above the candlesticks as depicted on Fig.1.1, the overall market sentiment is said to be bearish i.e. a trigger to sell the currency pair of interest.
- If the red line and black histograms of the BBWin forex indicator break below the zero horizontal level as exemplified on Fig. 1.1, price is said to be pressured lower, therefore a sell signal is said to be on the horizon.
Stop Loss for Sell Entry: Place stop loss above the upper Bollinger Band or above the previous swing high.
Exit Strategy/Take Profit for Sell Entry
Exit or take profit if the following takes center stage:
- If price surges to close above the medium sea green middle line of the Bollinger Bands indicator while a bearish trend is on course, more and more bears are said to be closing their positions, as such an exit or take profit stance will do.
- If the BBalert_Arrows indicator pops up a red upward pointing arrow while a bearish trend is running (refer to Fig. 1.1), a bullish reversal is said to be kicking in, thus an exit or take profit is duly recommended.
- If the red line of the BBWin indicator surges above the 0.00 horizontal level while a bearish trend is ongoing, it is pointing to diminishing bears power, thus a trigger to exit or take profit immediately.
Sell Trade Example: AUD/USD (Australian Dollar / US Dollar), M15 Chart
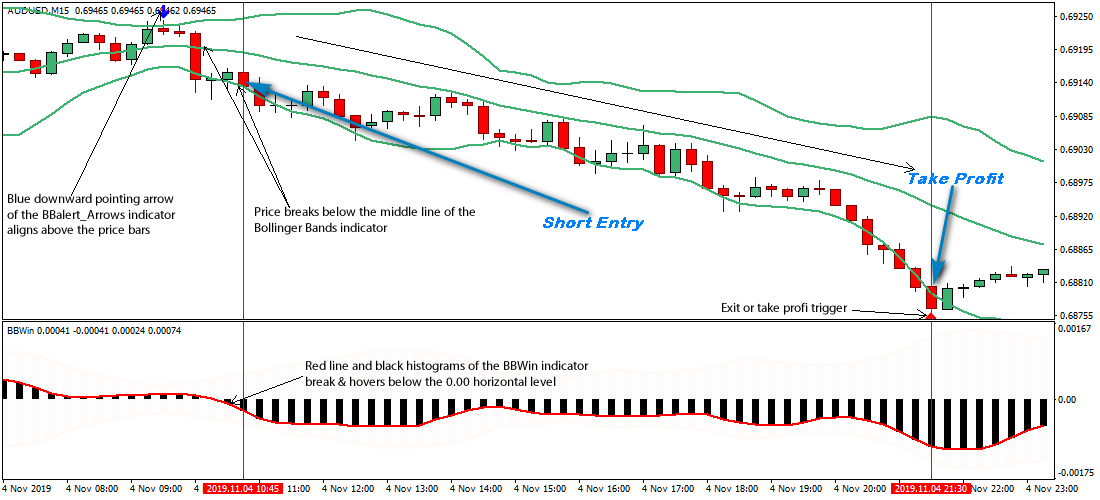
Fig. 1.1
Free Download
Download the Low Volatility Forex Trading Strategy
About The Forex Technical Indicators Used
The Bollinger Bands indicator is a tool that gauges volatility in the forex market, alongside other vital information like trend direction.
Bollinger Bands are actually plotted two standard deviations away from a simple moving average.
The BBalert_Arrows is a trend-following indicator that plots well-defined arrows below (bullish trend) and above (bearish trend) the price bars as a means of defining trends.
The BBWin custom indicator is a modified Bollinger Bands indicator that oscillates around a zero reference level within a separate window.
Easy Installation
Start using this forex strategy in just 5 minutes. Click here to get started now.