The Rockstar Forex trading strategy is all about eliminating losing trades and realizing more winning ones.
The strategy is based on some set of rules that takes advantage of forex market volatility.
We created this trend catching strategy using Bollinger Bands in conjunction with other some other interesting technical indicators.
As an important tool for assessing trends, the Rockstar Forex trading strategy helps in determining the most profitable underlying trend.
Try this Bollinger Bands based strategy for any trade style and become a Forex rockstar!
Chart Setup
MetaTrader 4 Indicators: MUV.ex4 (Colors Width Modified; #1=2), Bollinger Bands.ex4 (Parameters Modified; Period=36), Rads_MACD.ex4 (Default Parameters)
Preferred Time Frame(s): 1-Minute, 5-Minute, 15-Minute, 30-Minute, 1-Hour, 4-Hour, 1-Day, 1-Week, 1-Month
Recommended Trading Sessions: Any
Currency Pairs: Any pair
Download
Download the Rockstar Forex Trading Strategy
Buy Trade Example: GBP/USD (Sterling / US Dollar), H1 Chart

Fig. 1.0
Strategy
Long Entry Rules
Initiate a buy entry if the following indicator or chart pattern gets put on display:
- If the medium sea green middle line of the Bollinger Bands Metatrader 4 forex indicator crosses below the red MUV indicator line in a bottom up manner as illustrated on Fig. 1.0, bulls are said to be driving sentiments, therefore a buy market signal is appropriate.
- If the lime & red histograms of the Rads_MACD custom indicator stay above the 0.00 horizontal level as seen on Fig. 1.0, price is said to be driven to the upside, as such a buy alert is said to be looming.
Stop Loss for Buy Entry: Place stop loss below the previous swing low price level.
Exit Strategy/Take Profit for Buy Entry
Exit or take profit if the following rules or conditions takes precedence:
- If the medium sea green middle line of the Bollinger Bands forex indicator intersects the red MUV indicator line while a bullish trend is running (see Fig. 1.0), bulls are said to be leaving the market in their droves, hence an exit or take profit stance will suffice.
- If the Rads_MACD custom indicator displays a red histogram below the zero reference level during a bullish trend, a bearish reversal is said to be imminent i.e. a trigger to exit or take profit at once.
Sell Entry Rules
Enter a sell order if the following holds true:
- If the medium sea green middle line of the Bollinger Bands forex indicator crosses above the red MUV indicator line in a top downward fashion as exemplified on Fig. 1.1, the overall market sentiment is said to be bearish, thus a signal to sell the currency pair of focus.
- If the red & lime histograms of the Rads_MACD custom indicator stay below the 0.00 reference level as shown on Fig. 1.1, price is believed to be dragged lower, as such a sell alert is said to be on the horizon.
Stop Loss for Sell Entry: Place stop loss above the previous swing high price level.
Exit Strategy/Take Profit for Sell Entry
Exit or take profit if the following takes center stage:
- If the medium sea green middle line of the Bollinger Bands forex indicator intersects the red MUV indicator line during the course of a bearish trend (refer to Fig. 1.1), bears are said to be leaving the market increasingly, hence an exit or take profit stance is recommended.
- If the Rads_MACD custom indicator pops up a lime histogram above the zero reference level while a bearish trend is ongoing, a bullish reversal is said to be in the offing i.e. a trigger to exit or take profit straightaway.
Sell Trade Example: GBP/USD (Sterling / US Dollar), H1 Chart
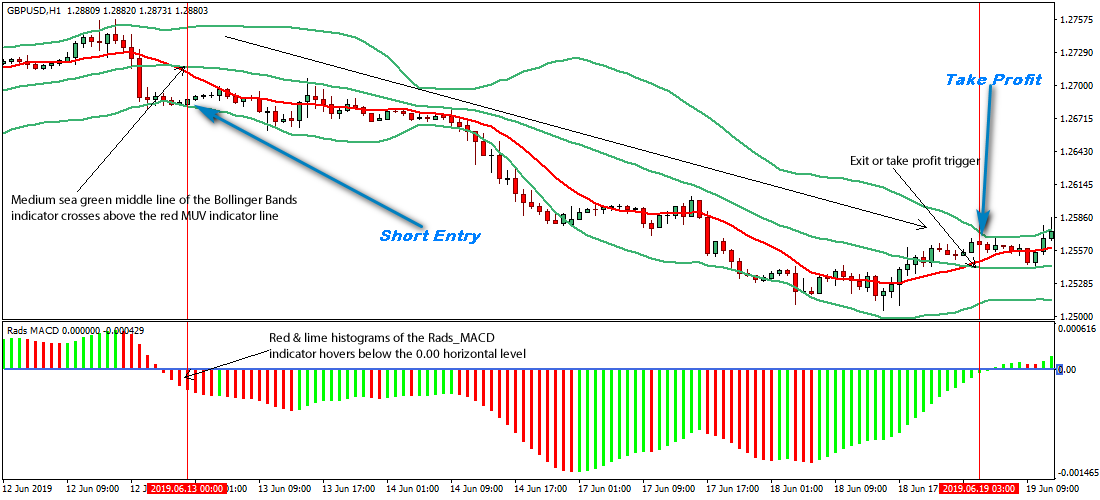
Fig. 1.1
Free Download
Download the Rockstar Forex Trading Strategy
About The Forex Technical Indicators Used
The MUV custom indicator is a Tom Demark (TD) Moving Average indicator for MetaTrader 4 and defines the logical locations for introducing stop loss orders or closing a trade.
The Bollinger Bands indicator is a tool that gauges volatility in the forex market alongside other vital information like sessions of market consolidation, direction of trend, possible tops and bottoms along with price targets.
The Bollinger Bands are actually plotted two standard deviations away from a simple moving average.
The Rads_MACD is an enhanced Moving Average Convergence Divergence (MACD) indicator that is used in spotting changes in momentum, direction strength and duration of a trend in a currency pair’s price.
Easy Installation
Start using this forex strategy in just 5 minutes. Click here to get started now.