The Simple Ichimoku Trend Forex strategy is a simple and effective trading system that uses a unique trading setup.
Three technical indicators make up this system and are said to be blended in a superior manner.
The trend patterns are easily noticed and you will need some time and practice to use it properly.
The strategy works best as a longer-term trading system that is poised to deliver consistent profit.
The following examples are carefully drafted to further show the trend following attributes of this strategy.
Chart Setup
MetaTrader4 Indicators: alternative-ichimoku.ex4 (Default Setting), super-trend.ex4 (Default Setting), precision-trend-histogram (Default Setting)
Preferred Time Frame(s): 15-Minutes, 30-Minutes, 1-Hour, 4-Hours, 1-Day, 1-Week
Recommended Trading Sessions: Any
Currency Pairs: Any pair
Download
Download the Simple Ichimoku Trend Forex Strategy
Buy Trade Example
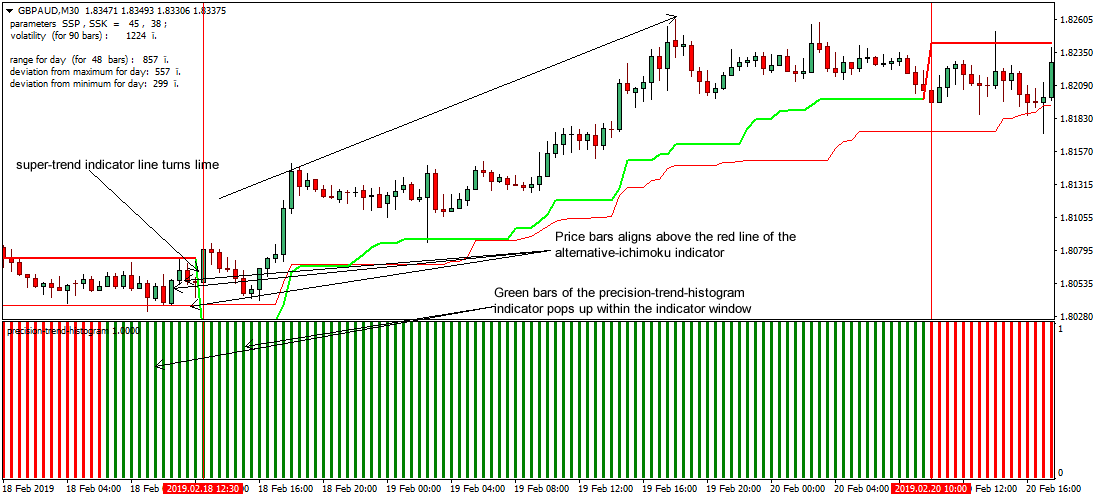
Fig. 1.0
Strategy
Long Entry Rules
Enter a bullish trade if the following indicator or chart pattern gets put on display:
- If price trades above the red line of the alternative-ichimoku Metatrader 4 custom indicator (see Fig. 1.0), bulls are said to be pushing price to the upside i.e. a trigger go long on the stipulated forex pair.
- If the super-trend indicator line turns lime while price trades somewhat above it as shown on Fig. 1.0, price is said to be driven higher i.e. a signal to go bullish on the desired currency pair.
- If the precision-trend-histogram indicator displays green bars within its indicator window as depicted on Fig. 1.0, price is said to be driven higher i.e. a trigger to go long on the designated fx pair.
Stop Loss for Buy Entry: Place stop loss below medium-term support.
Exit Strategy/Take Profit for Buy Entry
Exit or take profit from all trades if the following rules or conditions takes precedence:
- If price closes below the red line of the alternative-ichimoku custom indicator while a bullish trend is ongoing, more bulls are said to be leaving the market, hence an exit or take profit is advised.
- If the line of the super-trend indictor turns red during a bullish trend, it is indicative of diminishing bulls power, therefore an exit or take profit is recommended.
- If the precision-trend-histogram indicator bars turns red during the course of a bullish alert (see Fig. 1.0), it is a trigger to exit or take profit immediately.
Sell Entry Rules
Go short if the following setups gets displayed successfully on the activity chart:
- If price trades below the red line of the alternative-ichimoku indicator as seen on Fig. 1.1, bears are said to be driving price lower i.e. a trigger go short on the selected currency pair.
- If the super-trend indicator line turns red while price trades slightly below it as exemplified on Fig. 1.1, price is said to be pushed lower i.e. a signal to go bearish on the currency pair of interest.
- If the precision-trend-histogram indicator displays red bars within its indicator window as illustrated on Fig. 1.1, price is said to be pushed lower i.e. a signal to sell the preferred forex pair.
Stop Loss for Sell Entry: Place stop loss above medium-term resistance.
Exit Strategy/Take Profit for Sell Entry
Exit or take profit if the following takes center stage:
- If price closes above the red line of the alternative-ichimoku custom indicator during a buy signal, bears are said to be exiting their positions, hence an exit or take profit is recommended.
- If the line of the super-trend indictor turns lime while a bearish signal is running, it is indicative of weakening bears power, therefore an exit or take profit will suffice.
- If the precision-trend-histogram indicator bars turns green while a bearish signal is running (refer to Fig. 1.1), it is a trigger to exit or take profit at once.
Sell Trade Example
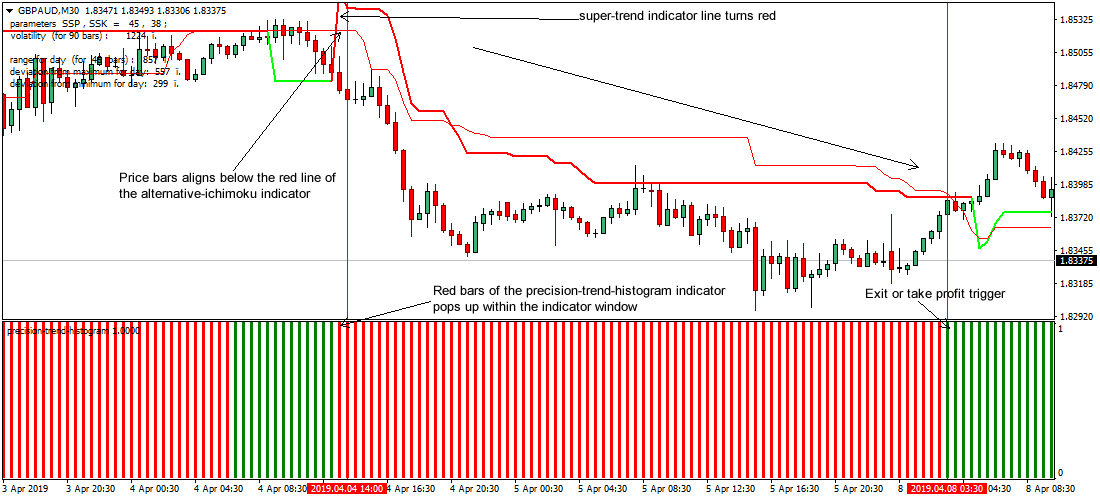
Fig. 1.1
Free Download
Download the Simple Ichimoku Trend Forex Strategy
About The Trading Indicators
The alternative-ichimoku.ex4 custom indicator was designed as an alternative to the well-known Ichimoku Kinko Hyo technical indicator.
The indicator is used to gauge momentum in line with likely zones of support and resistance.
The super-trend.ex4 indicator is a trend following and non-repainting custom indicator that is based on CCI.
The precision-trend-histogram.ex4 is an indicator that measures market trends quite well, with histograms that are colored according to the current “precision trend” state.