The simple Zone forex strategy is a mechanical trading system that deploys two technical analysis FX indicators in issuing out buy/sell forex trading signals.
Just about any trader can utilize this trading strategy considering its simplicity.
Chart Setup
MetaTrader4 Indicators: dsl_-_rsi.ex4 (default setting), Vidya_zone.ex4 (default setting)
Preferred Time Frame(s): 1-Minute, 5-Minutes, 15-Minutes, 30-Minutes, 1-Hour, 4-Hour
Recommended Trading Sessions: All sessions
Currency Pairs: Preferred majors and cross currency pairs
Download
Download the Simple Zone Forex Trading Strategy
Buy Trade Example
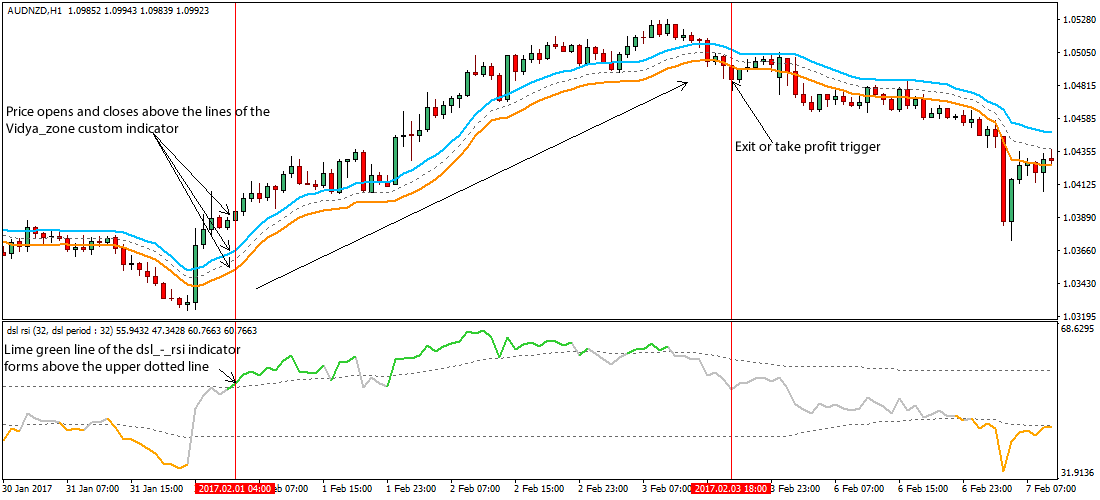
Fig. 1.0
Strategy
Long Entry Rules
Initiate a buy position if the following conditions or rules are visible on the activity chart:
- If price opens and closes above the Vidya_zone.ex4 custom indicator as shown on Fig. 1.0, price is said to be pushed higher i.e. a buy signal. It is noteworthy to state here that in most cases price is seen hovering above the “deep sky blue” line of the Vidya_zone.ex4 custom indicator, an indication that it is a strong bullish trend.
- If the lime green line of the dsl_-_rsi.ex4 custom indicator forms above its upper dotted line as depicted on Fig. 1.0, it is a sign that price is being pressured higher i.e. a buy alert.
Stop Loss for Buy Entry: Place stop loss below immediate support.
Exit Strategy/Take Profit for Buy Entry
Exit or take profit if the following indicator or chart patterns get displayed:
- If price closes below the dark orange line of the Vidya_zone.ex4 custom indicator as shown on Fig. 1.0, it is a reversal signal and traders are advised to exit or take profit without delay.
- If the line of the dsl_-_rsi.ex4 custom indicator declines lower to break its lower dotted line, this is a signal that price is reversing from its earlier bullish trend, an exit or take profit is strongly recommended.
Sell Entry Rules
Enter a sell in the market if the following rules or conditions hold sway in the market:
- If price opens and closes below the Vidya_zone.ex4 custom indicator as shown on Fig. 1.1, price is said to be pressured lower i.e. a sell signal. In most cases price is somewhat hovering below the dark orange line of the Vidya_zone.ex4 custom indicator, an indication that a strong bearish trend is ongoing.
- If the orange line of the dsl_-_rsi.ex4 custom indicator forms below its lower dotted line as depicted on Fig. 1.1, it is a sign that price is being pressured lower i.e. a sell alert.
Stop Loss for Sell Entry: Place stop loss above immediate resistance.
Exit Strategy/Take Profit for Sell Entry
Exit or take profit if the following indicator or chart pattern gets displayed:
- If price closes above the “deep sky blue” line of the Vidya_zone.ex4 custom indicator as shown on Fig. 1.1, it is a reversal signal and traders are advised to exit or take profit straight away.
- If the line of the dsl_-_rsi.ex4 custom indicator rises higher to break its upper dotted line, this is a signal that price is reversing from its earlier bearish trend, an exit or take profit is strongly recommended.
Sell Trade Example

Fig. 1.1
Free Download
Download the Simple Zone Forex Trading Strategy
About The Trading Indicators
The Vidya_zone.ex4 or Variable Index Dynamic Average Zone indicator uses the high, low and median prices for its calculation. The indicator relies on exponential smoothing as a foundation for changes in the rate trend.
The dsl_-_rsi.ex4 custom indicator on the other hand combines levels and signal line in defining overbought (sell signal) and oversold (buy signal) levels in the market.