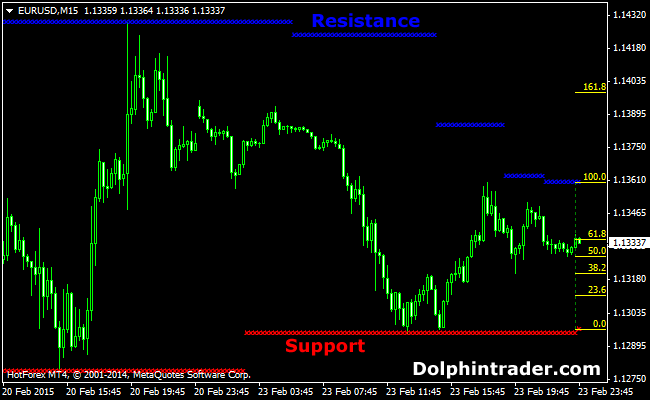
The support & resistance Forex indicator for MT4 identifies key support and resistance levels but also minor S&R levels and important Fibonacci retracement levels.
You can use support and resistance levels to trade reversals or break-outs and fib retracements to buy dips in uptrends and sell rallies in downtrends.
What to look for?
In uptrends, traders look to buy near the 38.2% Fibonacci Retracement level (buy on dips).
In downtrends, traders look to sell near the 38.2% Fibonacci Retracement level (sell on rallies).
Trading Signals
Uptrends: Look to go long at support levels in uptrends (buy dips). Buy breaks above resistance levels. Buy near the 38.2% fib level.
Downtrends: Look to go short at resistance levels in downtrends (sell rallies). Sell breaks below support levels. Sell near the 38.2% fib level.
Indicator Preferences
Currency pairs: any
Preferred Time frames: any
Sessions: any
Download
Download the support and resistance- Ac.ex4 indicator.
Configurable Indicator Options
Color
How to install the Support & Resistance Fibonacci Retracement custom indicator in Metatrader 4?
- Download the support and resistance- Ac.ex4 indicator to your computer.
- Open your Metatrader 4 platform.
- Open the data folder from the top menu.
- Open the MQL4 folder.
- Open the indicators folder.
- Paste the indicator file in this folder.
- Restart the trading platform.
- Open any trading chart.
- Attach the indicator to the chart.