The triple top / triple bottom forex trading strategy employs a unique price action pattern that tries to locate three swing highs/lows around the same level respectively.
In addition to this candlestick pattern, the Advanced Bollinger Bands and Alligator MT4 indicators are added to the chart for better trend recognition.
Chart Setup
MetaTrader4 Indicators: Advanced-bollinger_bands.ex4 (width modified), Alligator.ex4 (width modified)
Preferred Time Frame(s): Any
Recommended Trading Sessions: Any
Currency Pairs: Any
Download
Download the Triple Top / Triple Bottom Forex Trading Strategy
Buy Trade Example (Click the picture for full size view)
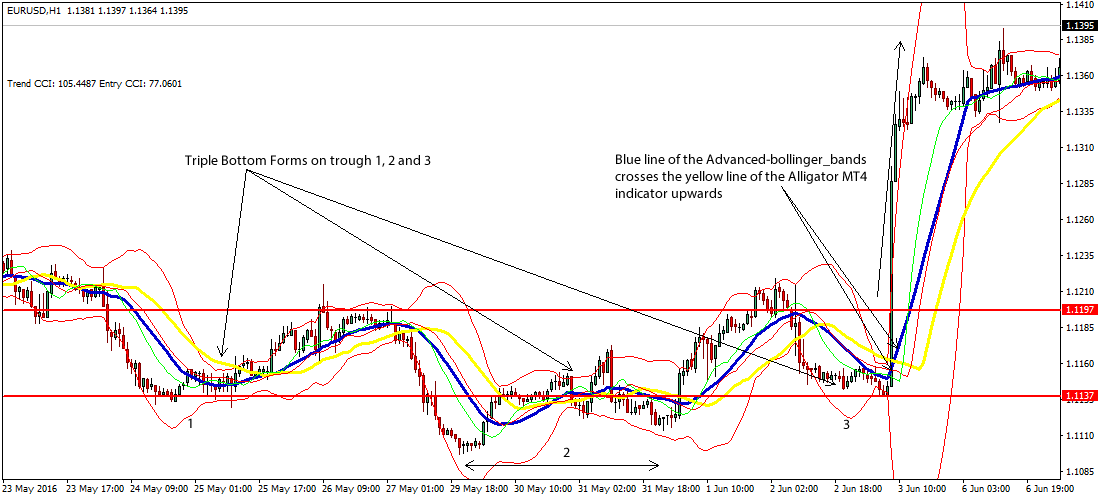
Fig. 1.0
Strategy
Long Entry Rules
Enter a buy position if the following conditions or rules apply:
- If a triple bottom price pattern forms with three swing lows around the same price level as seen on Fig. 1.0, with price breaking out above the resistance line (we had two unequal swing highs – which is obviously normal in normal market conditions), place a buy in the market.
- If the blue line of the Advanced-bollinger_bands.ex4 crosses the yellow line of the Alligator MT4 indicator upwards, it is an indication that price is pressured upwards i.e. a bullish signal.
Stop Loss for Buy Entry: Place stop loss below support.
Exit Strategy/Take Profit for Buy Entry
Exit or take profit on position(s) if the following chart or indicator patterns are on display:
- If a triple top price pattern or any other reversal price action pattern develops (refer to this section on our website for more price action strategies), an exit or take profit is advised.
- If the blue line of the Advanced-bollinger_bands.ex4 crosses the yellow line of the Alligator MT4 indicator downwards, it is a trigger to exit or take profit accordingly.
Sell Entry Rules
Enter a sell in the market if the following conditions or rules are ripe:
- If a triple top chart pattern forms and price eventually breaks below the key support level, a bears market can be initiated. Note that we have three unequal swing highs as well as the two unequal swing lows on Fig. 1.1 and this can make it tricky when drawing resistance and support lines.
- Following “rule 1” i.e. after the thirst swing high, if the blue line of the Advanced-bollinger_bands.ex4 crosses the yellow line of the Alligator MT4 indicator downwards, it is a trigger to sell.
Stop Loss for Sell Entry: Place stop loss above resistance.
Exit Strategy/Take Profit for Sell Entry
Exit or take profit on position(s) if the following rules or conditions holds true:
- If a reversal price action pattern develops (refer to our Price Action Strategies on our website for more reversal patterns), an exit or take profit is imminent.
- If the blue line of the Advanced-bollinger_bands.ex4 crosses the yellow line of the Alligator MT4 indicator upwards, an exit or take profit should be initiated.

Fig. 1.1
Free Download
Download the Triple Top / Triple Bottom Forex Trading Strategy
About The Trading Indicators
The triple top or triple bottom is a price action pattern that forms three swing highs or swing lows around the same price levels respectively.
The Alligator MT4 Indicator is a trend indicator designed by Bill Williams, hence it is tagged a Bill Williams indicator within the MT4 indicator entries. The indicator uses three components i.e. 5SMA (green), 8SMA (red) and 13SMA (blue) line in spotting trend changes.
The Advanced-bollinger_bands.ex4 custom indicator is a technical study that is built on the Bollinger Bands MT4 indicator and has its band period set at 20, while its band deviation is set at 2.0.