The Volatility Hyper Trend forex trading strategy is composed of the popular volatility hyper trend indicator and delivers buy and sell signals on all currency pairs.
The Volatility Hyper Trend is a custom MT4 indicator that does not repaint and delivers alert signals.
The indicator is quite an awesome tool for use by scalpers, day traders and market participants who wish to swing trade.
Learn below how it works and download for free:
Chart Setup
MetaTrader4 Indicators: Volatility Hyper Trend (Default Setting)
Preferred Time Frame(s): 1-Minute, 5-Minute, 15-Minute, 30-Minute, 1-Hour, 4-Hour, 1-Day
Recommended Trading Sessions: Any
Currency Pairs: Any pair
Download
Download the Volatility Hyper Trend Forex Trading Strategy
Buy Trade Example
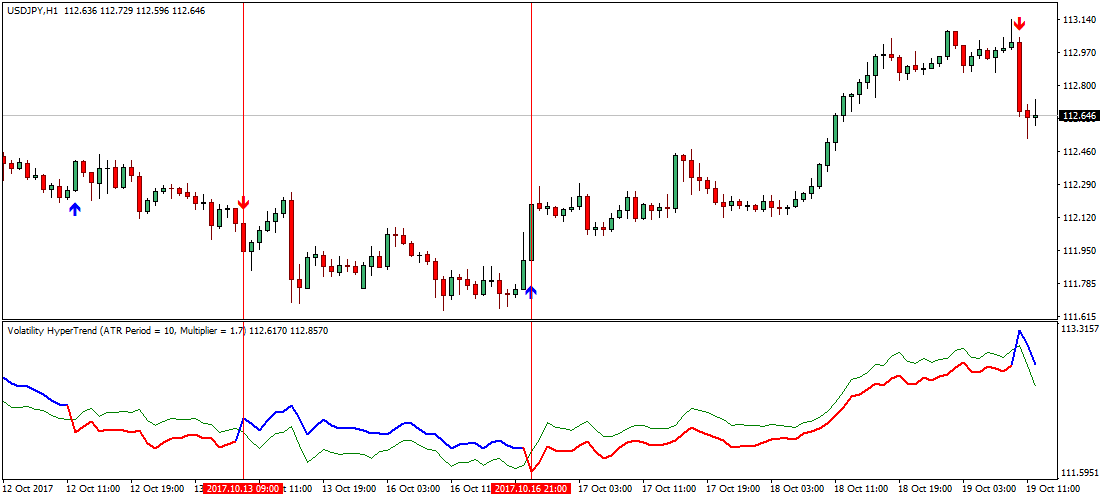
Fig. 1.0
Buy/Sell Trade Example
Buy Entry Rules:
- If the blue upward pointing arrow of the Volatility Hyper Trend custom MT4 indicator that is aligned below price bars appears on the activity chart, while the thick red line crosses the thin green line bottom up, then price is said to be pressured to the upside i.e. a trigger to buy the stipulated currency pair.
Stop Loss for Buy Entry: Place stop loss 5 pips below the blue “Buy Here” arrow.
Exit Strategy/Take Profit for Buy Entry
Exit or take profit if the following rules or conditions take precedence:
- If during a buy signal the red filled line within the indicator window turns blue, it is an exit or take profit trigger. Further confirmation of an exit or take profit occurs when a red downward pointing arrow pops up above the candles on the activity chart.
Sell Trade Example

Fig. 1.1
Sell Entry Rules:
- If the red downward pointing arrow of the Volatility Hyper Trend custom MT4 indicator that is aligned above the candles shows up on the activity chart, while the thick blue line crosses the thin green line in a top downward fashion, the sentiment in the market is said to be bearish i.e. a trigger to sell the designated forex pair.
Stop Loss for Sell Entry: Place stop loss 5 pips above the red “Buy Here” arrow.
Exit Strategy/Take Profit for Sell Entry
Exit or take profit if the following takes center stage:
- If while a sell is running the blue filled line within the indicator window turns red, it is an exit or take profit alert. Additional validation of an exit or take profit occurs when a blue upward pointing arrow pops up below price bars on the activity chart.
Free Download
Download the Volatility Hyper Trend Forex Trading Strategy
About The Trading Indicator
The Volatility Hyper Trend indicator displays red downward and blue upward pointing arrows on the activity chart.
The arrows offer a more visually appealing way of defining bearish and bullish price trend when trying to understand sell or buy market direction.
The indicator sub window displays trading signals as follows:
Sell: Blue line crosses the green line top downward, is represented by a red downward pointing arrow on the activity chart.
Buy: The instance where the thicker red line intersects the green line bottom up, is represented by the blue upward pointing arrow on the activity chart.