The best Trend Line Channel Forex trading Strategy uses a very common form of technical analysis during trend forecasting.
It is a known fact that drawing trend lines manually come with a lot of challenges for most traders.
We have decided to adopt a strategy that includes a technical tool that plots trend lines automatically.
The strategy draws trend line channels around price, allowing us see price patterns that go against the normal trend, either as trend reversals or price channel breakouts.
Chart Setup
MetaTrader4 Indicators: auto-trend-lines-channels.ex4 (Default Setting), stepma-signale.ex4 (Default Setting), pfd-snake-trend.ex4 (Inputs Variable Modified; Length=21)
Preferred Time Frame(s): 1-Minute, 5-Minute, 15-Minutes, 30-Minutes, 1-Hour, 4-Hours, 1-Day, 1-Week
Recommended Trading Sessions: Any
Currency Pairs: Any pair
Download
Download the Best Trend Line Channel Forex Trading Strategy
Buy Trade Example

Fig. 1.0
Strategy
Long Entry Rules
Enter a bullish trade if the following indicator or chart pattern gets put on display:
- If price trading within a channel subsequently breaks above the auto-trend-lines-channels indicator trend line as shown on Fig. 1.0, price is said to be pushing higher, as such a buy alert will suffice.
- If the dodger blue upward pointing arrow of the stepma-signale Metatrader 4 indicator pops up somewhat below the candlesticks with an accompanying lime green line (see Fig. 1.0), a buy signal is said to be appropriate.
- If the yellow upward pointing arrow of the pfd-snake-trend indicator pops up within the indicator window as exemplified on Fig. 1.0, bulls are said to be pushing price higher i.e. a trigger to go long on the selected currency pair.
Stop Loss for Buy Entry: Place stop loss below the most recent swing low price.
Exit Strategy/Take Profit for Buy Entry
Exit or take profit from all trades if the following rules or conditions takes precedence:
- If the auto-trend-lines-channels indicator forms price tops (denoted by a red shaped diamond), it might be a convenient time to consider closing or exiting long positions.
- If the stepma-signale indicator pops up a magenta downward pointing arrow during the course of a bullish trend, price is said to be making a probable reversal, therefore an exit or take profit will do.
- If the pfd-snake-trend indicator displays an aqua colored downward pointing arrow within its window (refer to Fig. 1.0), it is a signal to exit or take profit immediately.
Sell Entry Rules
Go short if the following setups gets displayed successfully on the activity chart:
- If price trading within a channel subsequently breaks below the auto-trend-lines-channels indicator trend line as illustrated on Fig. 1.1, price is said to be pressured lower, hence a trigger to go short on the fx pair of focus..
- If the magenta downward pointing arrow of the stepma-signale indicator pops up rather above the candlesticks with an accompanying orange line (check Fig. 1.1), a sell signal is said to be in view.
- If the aqua downward pointing arrow of the pfd-snake-trend indicator pops up within the indicator window as depicted on Fig. 1.1, bears are said to be driving price lower, therefore a sell signal should be the next line of action.
Stop Loss for Sell Entry: Place stop loss above the most recent swing high price.
Exit Strategy/Take Profit for Sell Entry
Exit or take profit if the following takes center stage:
- If the auto-trend-lines-channels indicator forms price bottoms (denoted by a green yellow shaped diamond) as exemplified on Fig. 1.1, it is a trigger to exit or take profit at once.
- If the stepma-signale indicator pops up a dodger blue upward pointing arrow during the course of a bearish alert, price is said to be making a likely bullish reversal, therefore an exit or take profit is advised.
- If the pfd-snake-trend indicator displays a yellow colored upward pointing arrow within its window during the course of a bearish signal, it is a signal to exit or take profit straightaway.
Sell Trade Example
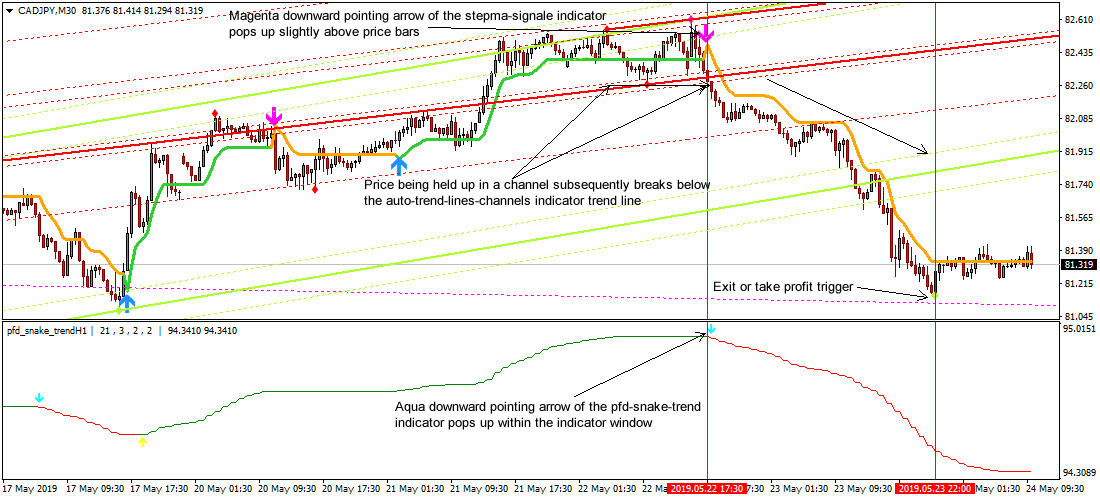
Fig. 1.1
Free Download
Download the Best Trend Line Channel Forex trading Strategy
About The Trading Indicators
The auto-trend-lines-channels.ex4 is a trend line tool that automatically plots multiple trend lines on the activity chart.
The stepma-signale.ex4 is a Metatrader 4 indicator that is based on multiple moving averages and does well in gauging trends.
The pfd-snake-trend.ex4 custom indicator is a momentum tool that can be used to define trend, along with finding possible reversal points in the market.