The buy sell magic forex trading strategy uses three easy to read technical indicators and is simple at its approach when it comes down to generating buy/sell alerts.
Chart Setup
MetaTrader4 Indicators: BuysellMagic02.ex4 (default setting), Bears.ex4 (width & color modified) & Bulls.ex4 (width & color modified)
Preferred Time Frame(s): 1-Minute, 5-Minutes, 15-Minutes, 30-Minutes, 1-Hour, 4-Hours
Recommended Trading Sessions: All excl. Asian Open
Currency Pairs: any
Download
Download the Buy Sell Magic Forex Trading Strategy
Buy Trade Example (Click the image for full size)
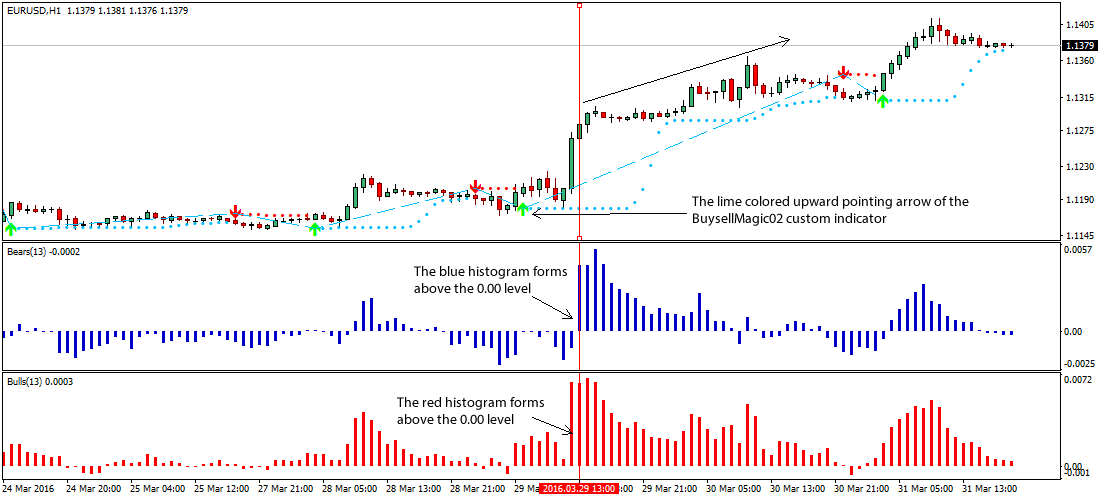
Fig. 1.0
Strategy
Long Entry Rules
Enter a long position when the following conditions or rules are in display on the activity chart:
- If the lime upward pointing arrow of the BuysellMagic02 custom indicator forms below price bars, it indicates a bullish signal.
- Watch out for the blue histogram of the Bears custom indicator form above the 0.00, this setup defines an increasing bullish pressure, thus a buy is in accordance.
- The red histogram of the Bulls custom indicator above the 0.00 level, agrees to a bullish entry.
Stop Loss for Long Entry: Place stop-loss below the most recent support level.
Exit Strategy/Take Profit for Long Entry
The following conditions or rules are indicative of an exit or take profit trigger:
- If a red downward pointing arrow of the BuysellMagic02 custom indicator forms above price bars, it is an indication that price is going to make a U-turn and as such an exit or take profit is advised.
- If the blue histogram of the Bears custom indicator diminishes into the 0.00 level, it describes a decrease in volatility and as such an exit or take profit is advised.
- Likewise, if the red histogram of the Bulls custom indicator collapses into the 0.00 levels, it is a sign of reduces buy pressures, an exit is appropriate.
Sell Entry Rules
Enter a sell order when the following indicator/chart patterns are in place:
- If a red downward pointing arrow of the BuysellMagic02 custom indicator forms above price bars, it is an okay signal for a sell order.
- If the blue histogram of the Bears custom indicator forms below the 0.00 level, it Okays a sell entry.
- Similarly, if the red histogram of the Bulls custom indicator forms below the 0.00 levels, it signals a bears market.
Stop Loss for Sell Entry: Place stop-loss above the most recent resistance level.
Exit Strategy/Take Profit for Sell Entry
Exit or take profit on positions when the following conditions or rules are in place:
- If the lime colored arrow of the BuysellMagic02 custom indicator forms below price bars, it is a reversal signal.
- If the blue histogram of the Bears custom indicator fades into the 0.00 level, an exit or take profit is advised.
- In the same vein, if the red histogram of the Bulls indicator fades into the 0.00 level, it alerts an exit or take profit on position(s).

Fig. 1.1
Free Download
Download the Buy Sell Magic Forex Trading Strategy
About The Trading Indicators
The BuysellMagic02.ex4 custom indicator is a technical study that forms red/lime arrow above or below price bars in defining bullish or bearish trends for the asset under investigation.
The Bears and Bulls indicators are custom indicators that are designed to show the underlying strength of the existing trend.