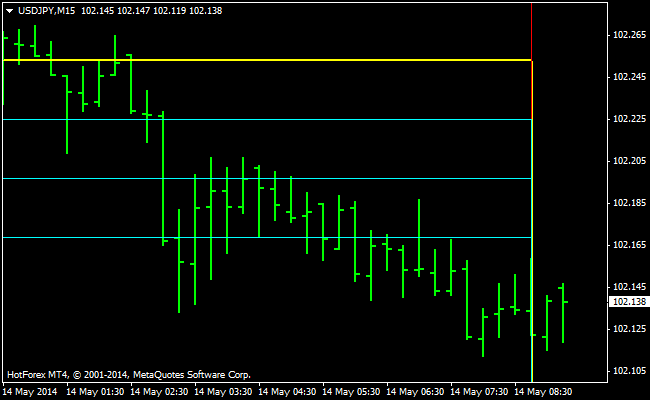
The Camarilla pivot point indicator provides a new way of calculating the pivot point (PP) and accompanying support and resistance levels.
- Used formula’s: Pivot point: (high price + low price + closing price)/3,
- Resistance 1: closing price + (high – low for the give timeframe) x 1.1/12,
- Support 1: closing price – (high – low for the give timeframe) x 1.1/12.
General Assumptions
Bullish: Price trades above the Camarilla pivot point (yellow line)
Bearish: Price trades below the Camarilla pivot point (yellow line)
Indicator Preferences
Currency pairs: any
Preferred Time frames: Up to the 4 hour charts
Sessions: any
Download
Download the CamarillaOnly.mq4 indicator.
Configurable Indicator Options
Colors default: (Red, Yellow, Aqua)
USD/JPY 15 Min Chart Example
How to install the Camarilla Pivot Point custom indicator in Metatrader 4?
- Download the CamarillaOnly.mq4 indicator to your computer.
- Open your Metatrader 4 platform.
- Open the data folder from the top menu.
- Open the MQL4 folder.
- Open the indicators folder.
- Paste the indicator file in this folder.
- Restart the trading platform.
- Open any trading chart.
- Attach the indicator to the chart.
