The Klanny Trend forex strategy is designed to bring to FX traders buy/sell market opportunities via an easy to understand trading system.
Check out the rules to enter and exit trades on any timeframe of your choice. Beginner can also benefit from this strategy.
Chart Setup
MetaTrader4 Indicators: my_squeeze_Light.ex4 (default setting), KlannyTrend.ex4 (default setting)
Preferred Time Frame(s): 1-Minute, 5-Minutes, 15-Minutes, 30-Minutes, 1-Hour, 4-Hour, Day, Week
Recommended Trading Sessions: Any
Currency Pairs: Any pair
Download
Download the Klanny Trend Forex Trading Strategy
Buy Trade Example

Fig. 1.0
Strategy
Long Entry Rules
Initiate a buy entry if the following chart or indicator pattern takes center stage:
- If the KlannyTrend custom indicator forms yellow upward pointing arrow(s) aligned below price bars as shown on Fig. 1.0, the sentiment in the market is said to be bullish i.e. a long entry is advised.
- If the blue and lime histograms of the my_squeeze_Light.ex4 indicator form above the 0.00 middle line, it is a signal that price is bullish. The rising lime colored histograms denote extreme bullish conditions.
Stop Loss for Buy Entry: Place stop loss 3 pips below support.
Exit Strategy/Take Profit for Buy Entry
Exit or take profit if the following conditions or rules take precedence:
- If the KlannyTrend custom indicator forms red downward pointing arrow(s) aligned above price bars as shown on Fig. 1.0, it is a trigger to exit or take profit accordingly.
- If the my_squeeze_Light.ex4 custom indicator forms blue or red histogram that is aligned below the 0.00 middle line, it is a trigger to exit or take profit accordingly.
Sell Entry Rules
Initiate a sell order if the following conditions or rules holds true:
- If the KlannyTrend custom indicator forms red downward pointing arrow(s) aligned above price bars as shown on Fig. 1.1, it is an indication of bearish sentiment in the market i.e. a sell signal.
- If the my_squeeze_Light.ex4 custom indicator forms blue or red histograms that are aligned below the 0.00 middle line, it is said to be price pushing lower i.e. a sell signal. The red histogram is an indication of an extreme bearish market.
Stop Loss for Sell Entry: Place stop loss 3 pips above resistance.
Exit Strategy/Take Profit for Sell Entry
Triggers for an exit or take profit is as follows:
- If the KlannyTrend custom indicator forms a yellow upward pointing arrow(s) aligned below the candlesticks as depicted on Fig. 1.1, it is a trigger to exit or take profit accordingly.
- If the my_squeeze_Light.ex4 custom indicator forms a blue or lime histogram that is aligned above the 0.00 middle line, it is a trigger to exit or take profit accordingly.
Sell Trade Example
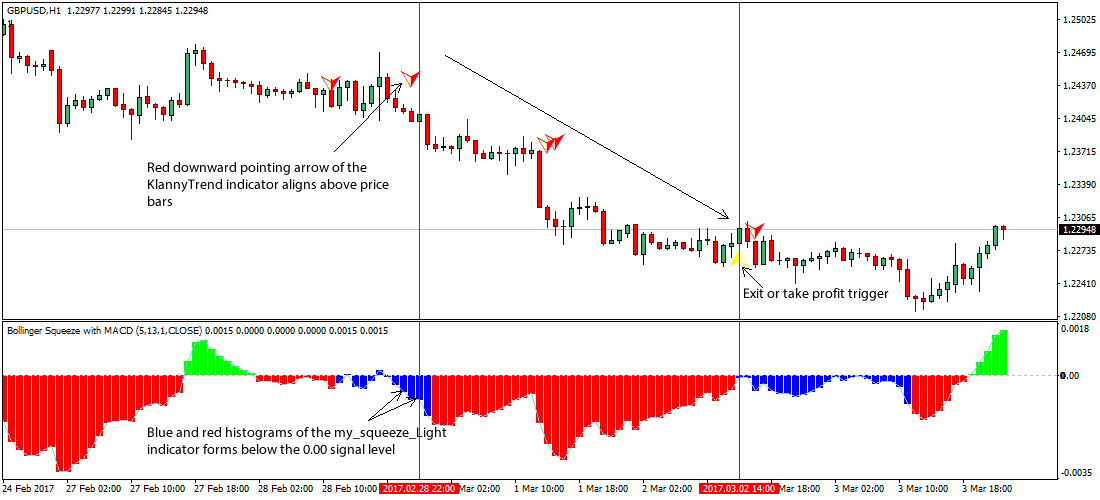
Fig. 1.1
Free Download
Download the Klanny Trend Forex Trading Strategy
About The Trading Indicators
The KlannyTrend.ex4 custom indicator is a trend following indicator that gives traders clues as to the overall trend, using yellow arrows to indicate bullish trend and red arrows to depict bearish trend.
The my_squeeze_Light.ex4 custom indicator is designed from the Bollinger Squeeze along with the MACD, and deploys colored (lime, red and blue) histograms to determine price swings.