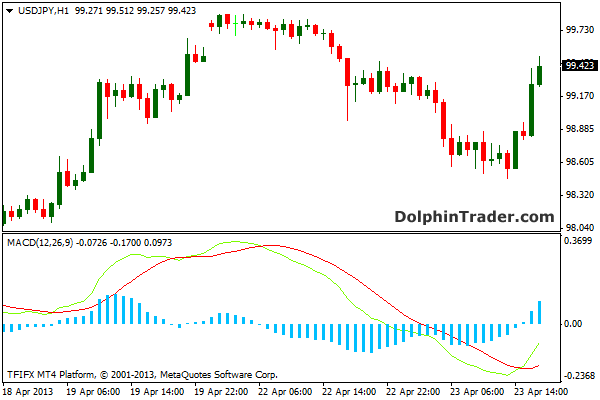
MACD OSMA for MT4 is an oscillator indicator based on one SMA (signal) and two EMA moving averages (cross).
The green line closing above the red line gives bullish signal.
The red line closing above the green line gives bearish signal.
- MACD histogram above 0 means bullish trend.
- MACD histogram below 0 means bearish trend.
Trading Signals
BUY: MACD histogram > 0 and green signal line closing above red signal line.
SELL: MACD histogram > 0 and red signal line closing above green signal line.
Use in conjunction with trend analysis tools to determine the primary trend.
Don’t use MACD OSMA against the primary trend.
Download
Download the MACD OSMA.mq4 indicator.
USD/JPY 1 Hour Chart Example
How to install the MACD OSMA custom indicator in Metatrader 4?
- Download the MACD OSMA.mq4 indicator to your computer.
- Open your Metatrader 4 platform.
- Open the data folder from the top menu.
- Open the MQL4 folder.
- Open the indicators folder.
- Paste the indicator file in this folder.
- Restart the trading platform.
- Open any trading chart.
- Attach the indicator to the chart.
