The Gross Domestic Product (GDP) gauges the annualized adjustment in the inflation-attuned value of all goods and services that are produced by the U.S. economy.
It is one of the most far-reaching measure of economic activity and the key indicator of the health of the economy.
This report is reported monthly and has 3 versions i.e. advance, second and final release. The advance and the second reading are tagged as preliminary in the data calendar.
Traders who can take advantage of the huge fluctuations in prices during this release will rake in some good profits.
Chart Setup
MetaTrader4 Indicators: MTF_Forex_Freedom_Bar.ex4 (default setting), Exponential Moving Average (14)
Preferred Time Frame(s): 1-Minute, 5-Minutes, 15-Minutes
Recommended Trading Sessions: After news release
Currency Pairs: Majors
Download
Download MTF Forex Trading Strategy on U.S. Gross Domestic Product
Trade Example (Click the chart for full size view)
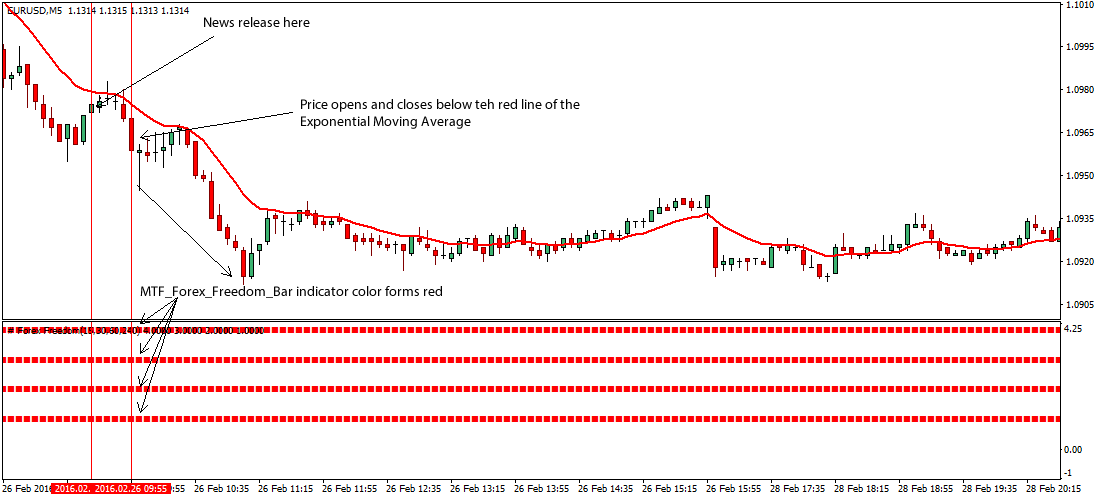
Fig. 1.0
Strategy
Long Entry Rules
Initiate a buy entry when the following rules or conditions are in display 20-minutes after the news release:
- If the four periods of the MTF_Forex_Freedom_Bar.ex4 custom indicator represented by four rows of rectangular bars turns blue, it indicates that price is bullish.
- If price bar opens and closes above the red line of the Exponential Moving Average (14), it is a sign that price the trend is bullish.
Stop Loss for Long Entry: Place stop loss below immediate support.
Exit Strategy/Take Profit for Long Entry
Exit or take profit on position if the following chart/indicator pattern are in display:
- If any of the color of the four rows of MTF_Forex_Freedom_Bar.ex4 custom indicator turns red, it a signal that seller pressure is building in the market, hence the need for an exit or take profit strategy.
- If price closes below the red line of the Exponential Moving Average (14), it denotes a possible reversal in trend
Sell Entry Rules
Initiate a sell entry 20 minutes after the release of the U.S. Gross Domestic Product (GDP) as shown on Fig. 1.0:
- If the rows of the MTF_Forex_Freedom_Bar.ex4 custom indicator turns red, it is a signal that price is experiencing downward pressures.
- If price opens and closes below the red line of the Exponential Moving Average (14), it denotes a sell/bearish signal.
Stop Loss for Sell Entry: Place stop loss above immediate resistance.
Exit Strategy/Take Profit for Sell Entry
Exit or take profit under the following conditions or chart rules:
- If any of the color of the four rows of MTF_Forex_Freedom_Bar.ex4 custom indicator turns blue, it a take profit or an exit alert.
- If by any means price closes above the red line of the Exponential Moving Average (14), it is a signal prompting the exit of open position(s).
Free Download
Download the MTF Forex Trading Strategy on U.S. Gross Domestic Product
About The Trading Indicators
The Exponential Moving Average (14) measures the average price but adds more weight to the latest price.
The MTF_Forex_Freedom_Bar.ex4 is a custom indicator that is based on the CCI (Commodity Channel Index) indicator.
The indicator is such that it allows traders spot the time when all CCI signals settle on a trend. Blue color denotes uptrend, while the red signifies a downtrend.