The Parabolic Close forex strategy integrates the Parabolic-close and the 5_34_5 custom indicator in delivering simple to read buy and sell trading alerts on any currency pair of your choice.
The strategy is easy to adopt by beginners and advanced traders alike.
Chart Setup
MetaTrader4 Indicators: Parabolic-close.ex4 (default setting), 5_34_5.ex4 (default setting)
Preferred Time Frame(s): 1-Minute, 5-Minutes, 15-Minutes, 30-Minutes, 1-Hour, 4-Hour
Recommended Trading Sessions: Any
Currency Pairs: Any pair, preferred low spread FX pairs
Download
Download the Parabolic Close Forex Trading Strategy
Buy Trade Example
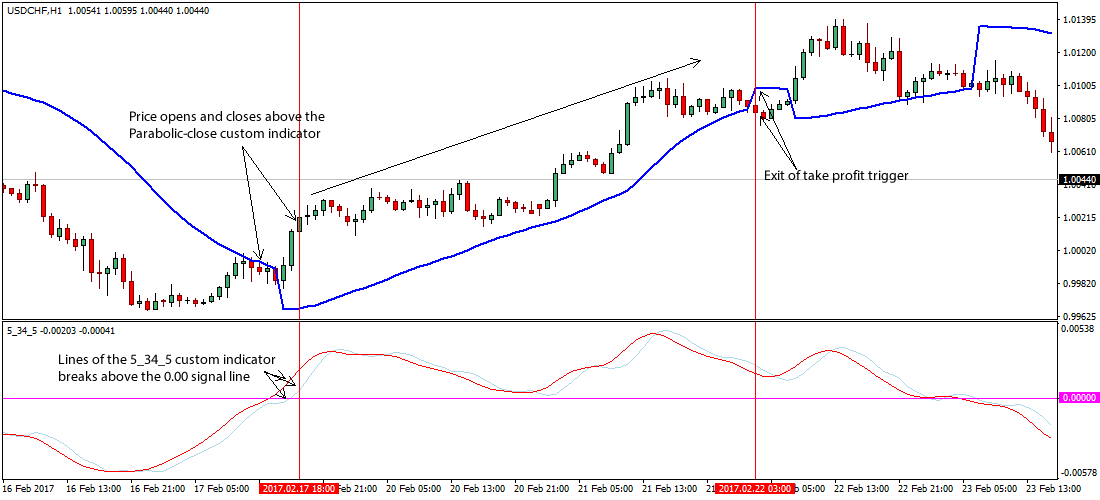
Fig. 1.0
Strategy
Long Entry Rules
Enter a buy position if the following rules or conditions hold sway:
- If price opens and closes above the blue line of the Parabolic-close custom indicator, price is said to be pressured higher i.e. a buy signal. The wider the gap between price bars and the blue line of the Parabolic-close indicator, the stronger the bullish trend.
- If the lines of the 5_34_5 custom indicator breaks above the 0.00 signal line as shown on Fig. 1.0, price is said to be bullish, thus supporting our sentiment in “1” i.e. a buy order is appropriate.
Stop Loss for Buy Entry: Place stop loss below supprt.
Exit Strategy/Take Profit for Buy Entry
Exit or take profit is the following chart or indicator pattern gets displayed:
- If price closes below the blue line of the Parabolic-close custom indicator, an exit or take profit is advised.
- If the lines of the 5_34_5 custom indicator breaks below the 0.00 signal line, an exit or take profit is most appropriate.
Sell Entry Rules
Enter a sell order if the following conditions or rules are true:
- If price opens and closes below the blue line of the Parabolic-close custom indicator, price is said to be pressured to the downside i.e. a sell signal. Note that the wider the gap between price bars and the blue line of the Parabolic-close indicator during a down trend, the stronger the bearish trend.
- If the lines of the 5_34_5 custom indicator breaks below the 0.00 signal line as shown on Fig. 1.1, price is said to be bearish i.e. a sell signal is ripe.
Stop Loss for Sell Entry: Place stop loss above resistance.
Exit Strategy/Take Profit for Sell Entry
Exit or take profit on position(s) if the following are true:
- If price closes above the blue line of the Parabolic-close custom indicator, an exit or take profit is advised.
- If the lines of the 5_34_5 custom indicator breaks above the 0.00 signal line, an exit or take profit is most suitable.
Sell Trade Example

Fig. 1.1
Free Download
Download the Parabolic Close Forex Trading Strategy
About The Trading Indicators
The Parabolic-close.ex4 custom indictor is a modified Parabolic SAR indicator that can be deployed in analyzing trending markets.
The Parabolic-close is constructed on the price chart in the form of a line.
It shares a lot of similarities with the moving average indicator, but the only difference is that it moves with higher acceleration and may alter its position in relation to price.
The 5_34_5.ex4 is a custom indicator with an obvious strange name and oscillates around the 0.00 signal level. It pops up in its own indicator window and comprises of two lines (light blue and a red).