The ability for traders to adapt to new market conditions is a needed ingredient to become successful when trading currencies online.
If you speak to successful Forex traders or investors, it becomes clear that their heightened ability and knowledge to forecast the market better is as a result of their cutting-edge approach to trading.
Our Trend Forecaster Forex strategy is designed to forecast currency trends better and faster for any currency pair and timeframe.
Let’s take you through this great trading strategy:
Chart Setup
MetaTrader4 Indicators: auto-trend-forecaster.ex4 (Inputs Variable Modified; TMperiod=38, SL_distance_pips=210), varmov.ex4 (Inputs Variable Modified; periodAMA=60, nfast=30, nslow=20, G=1.2)
Preferred Time Frame(s): 1-Minute, 5-Minute, 15-Minutes, 30-Minutes, 1-Hour, 4-Hours, 1-Day, 1-Week
Recommended Trading Sessions: Any
Currency Pairs: Any pair
Download
Download the Trend Forecaster Forex Strategy
Buy Trade Example

Fig. 1.0
Strategy
Long Entry Rules
Enter a bullish trade if the following indicator or chart pattern gets put on display:
- If the auto-trend-forecaster Metatrader 4 forex indicator line turns dodger blue within the indicator window as seen on Fig. 1.0, overall market sentiment is said to be bullish, therefore taking up buy positions is appropriate.
- If the green dotted sienna line of the varmov custom indicator stay slightly below the price bars as illustrated on Fig. 1.0, price is said to be driven to the upside, thus a buy order will suffice.
Stop Loss for Buy Entry: Place stop loss 1-3 pips below support.
Exit Strategy/Take Profit for Buy Entry
Exit or take profit from all trades if the following rules or conditions takes precedence:
- If the auto-trend-forecaster indicator line turns tomato while a bullish trend is running, a bearish reversal is said to be on the horizon, hence an exit or take profit is duly advised.
- If the varmov indicator pops up a red dot on its sienna line as depicted on Fig. 1.0, it is indicative of weaning bulls power, as such an exit or take profit is recommended.
Sell Entry Rules
Go short if the following setups gets displayed successfully on the activity chart:
- If the auto-trend-forecaster forex indicator line turns tomato within the indicator window as exemplified on Fig. 1.1, the general market sentiment is said to be bearish i.e. a sell alert is said to be in the cards.
- If the red dotted sienna line of the varmov custom indicator stay fairly above the candlesticks (see Fig. 1.1), price is said to be pushed lower i.e. a trigger to sell the selected forex pair.
Stop Loss for Sell Entry: Place stop loss 1-3 pips above resistance.
Exit Strategy/Take Profit for Sell Entry
Exit or take profit if the following takes center stage:
- If the auto-trend-forecaster indicator line turns dodger blue while a bearish trend is ongoing, a bullish reversal is said to be just round the corner, hence an exit or take profit is recommended.
- If the varmov indicator pops up a green dot on its sienna line as indicated on Fig. 1.1, more bears are said to be leaving the market, as such an exit or take profit stance will do.
Sell Trade Example
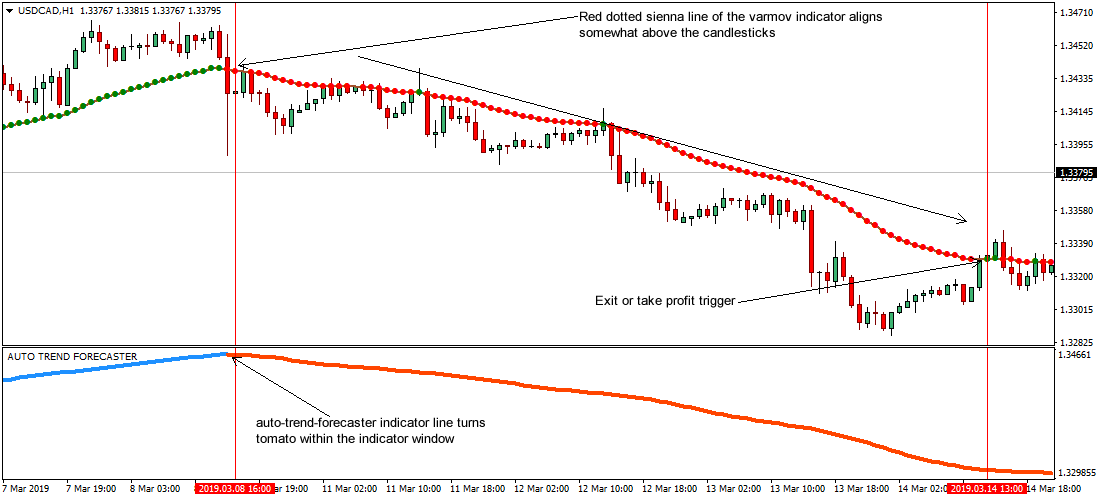
Fig. 1.1
Free Download
Download the Trend Forecaster Forex Strategy
About The Trading Indicators
The auto-trend-forecaster.ex4 is a technical indicator used in forecasting forward-trending market moves.
The varmov.ex4 or Var Moving Average Metatrader 4 indicator is a trend following indicator designed for die-hard trend followers.
It is a popular forex trading indicator among stock and commodity traders.