The Daily Time Frame Forex strategy for Metatrader 5 is designed for traders who like to trade off the daily timeframe.
It’s a great trend following strategy that is based on the Alligator and Center of Gravity technical indicators.
Daily timeframe: You only need to check the charts once a day for new buy/sell signals.
I recommend to load the strategy on at least 6 currency pairs.
Trade Setup
MetaTrader 5 Indicators: Alligator.ex5 (Default Setting), Center of Gravity.ex5 (Inputs Variable Modified; Period=56, Price=Close price)
Trade Style: Swing trading
Trading Sessions: London | New York | Tokyo
Currency Pairs: Majors, cross pairs, exotics
Platform: Metatrader 5 (MT5)
Download
Download the Daily Time Frame Forex Strategy For Metatrader 5
Buy Trade Example: EURCAD, D1 Chart
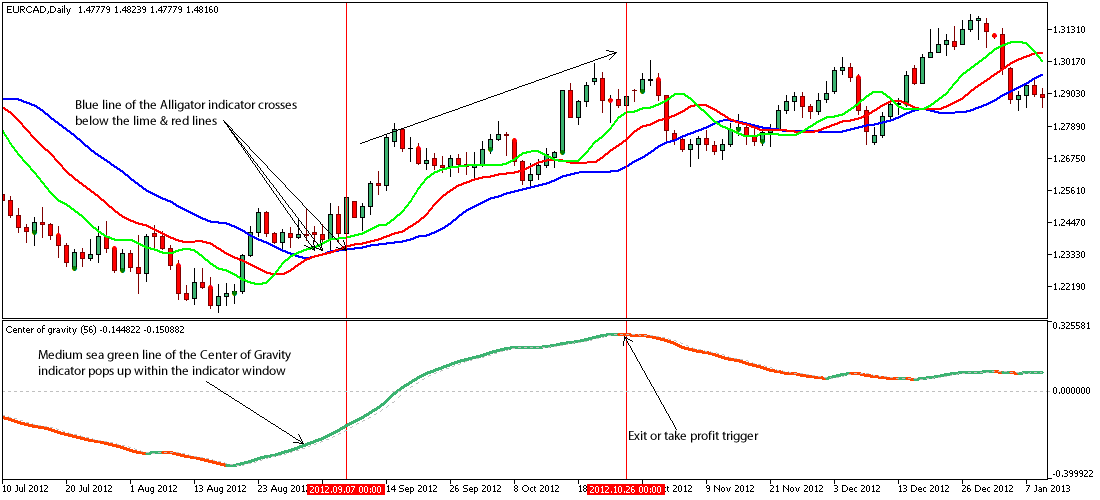
Fig. 1.0
Trading Strategy Rules For Buy and Sell Trades Explained
Buy Entry
Enter a buy trade if the following trading conditions are met:
- If the blue line of the Alligator Metatrader 5 forex indicator crosses below the lime and red lines as exemplified on Fig. 1.0, price is said to be driven to the upside i.e. a trigger to buy the designated forex pair.
- If the medium sea green line of the Center of Gravity custom indicator pops up within the indicator window as shown on Fig. 1.0, the overall market sentiment is said to be bullish, therefore a buy trigger is said to be on the horizon.
Suggested Stop Loss for Buy Entry: Place stop loss below long-term support.
Suggested Exit Strategy/Take Profit for Buy Trade
Exit the buy trade if the following trading conditions are met:
- If price bar closes below the blue line of the Alligator indicator while a bullish trend is ongoing, a bearish reversal is said to be imminent, as such an exit or take profit is advised.
- If the Center of Gravity custom indicator line changes to orange red during the course of a bullish signal, more and more bulls are said to be closing their positions, therefore an exit or take profit is recommended.
Sell Entry
Open a sell trade if the following trading conditions are met:
- If the blue line of the Alligator indicator crosses above the lime and red lines as depicted on Fig. 1.1, price is said to be dragged to the downside i.e. a trigger to sell the selected currency pair.
- If the orange red line of the Center of Gravity forex indicator pops up within the indicator window as seen on Fig. 1.1, the general market sentiment is said to be bearish, therefore a sell signal is said to be approaching.
Suggested Stop Loss for Sell Entry: Place stop loss above long-term resistance.
Suggested Exit Strategy/Take Profit for Sell Entry
Exit the sell trade if the following trading conditions are met:
- If price bar closes above the blue line of the Alligator indicator during a bearish trend, a bullish reversal is said to be in the cards, as such an exit or take profit will suffice.
- If the Center of Gravity custom indicator line reverts to medium sea green during the course of a bearish signal, bears are said to be closing their positions increasingly, therefore an exit or take profit stance will do.
Sell Trade Example: EURCAD, D1 Chart
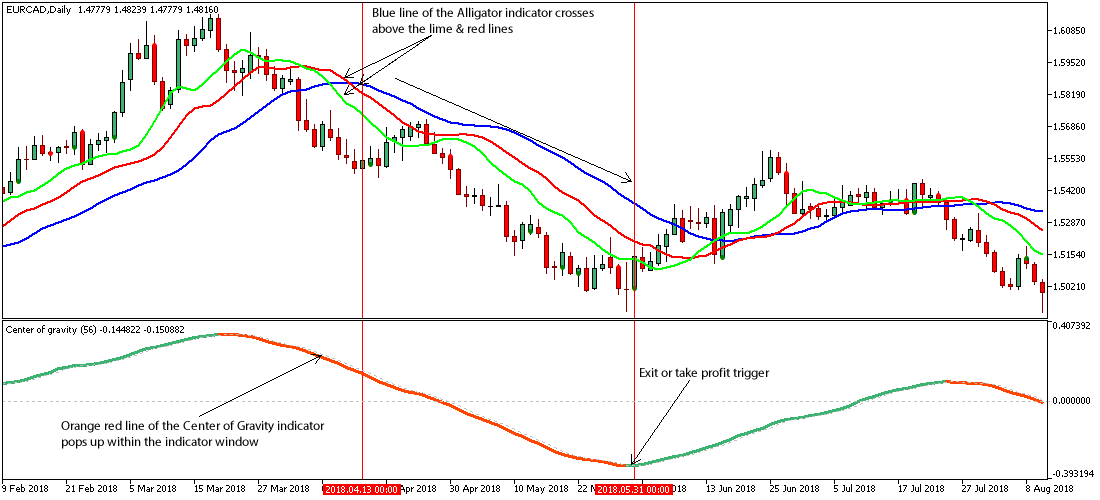
Fig. 1.1
Free Download
Download the Daily Time Frame Forex Strategy For Metatrader 5
MT5 Trading Indicators Used For This Strategy
The Alligator is a technical indicator by Bill Williams, introduced in 1995, the indicator is comprised of three lines that are overlaid on the activity chart.
The lines represent the jaw, the teeth and the lips of the Alligator.
Traders tend to use this indicator to gauge trend and its possible direction.
The Center of Gravity is a technical indicator that adopts a correction in the calculation that allows the use of a significant level.
It is most used in deciding where the trend will go.